OPEN-ACCESS PEER-REVIEWED
RESEARCH ARTICLE
Deblina Biswas, Laure Ray, and Matthew Halquist*
Department of Pharmaceutics, School of Pharmacy, Virginia Commonwealth University, Richmond, VA 23298-0533, USA.
Reviews in Separation Sciences. Vol.1. No.1. pages 3-16 (2019).
Published 15 October 2019. https://doi.org/10.17145/rss.19.002 | (ISSN 2589-1677).
- Abstract
- Keywords
- 1.0 Introduction
- 2.0 Materials and methods
- 2.1. Chemicals and reagents
- 2.2. Equipment and software
- 2.3. Preparation of Mobile Phase, Stock Solutions, Calibration Standards And Quality Controls
- 2.4. Chromatographic Method Development Conditions
- 2.5. Method Validation
- 2.6. Stability Of rhBMP-2
- 2.7. Stability Indicating Method Conditions
- 2.8. Differential Isoforms of recombinant human Bone Morphogenetic Protein-2 (rhBMP-2)
- 2.9. Qualitative characterization of rhBMP-2 glycoforms and forced degradation products using mass spectrometry
- 3.0 Results and discussion
- 3.1 Method development
- Figures and Tables
- 3.2 Method validation
- 3.3. Stability Indicating Studies-Forced Degradation Analysis
- 3.4. Qualitative mass spectral characterization of glycoforms of BMP-2 and changes observed in stressed samples during forced degradation
- 3.5. Method application to samples of in vitro release study
- 4.0 Conclusion
- 5.0 Acknowledgments
- 6.0 References
*Correspondence:
Halquist M. . Department of Pharmaceutics, School of Pharmacy, Virginia Commonwealth University, Richmond, VA 23298-0533, USA.
Editor: Dr. Marcello Locatelli, University “G. d’ Annunzio” of Chieti-Pescara, Chieti, Italy.
Open-access and Copyright:
©2019 Biswas D et al. This article is an open access article distributed under the terms of the Creative Commons Attribution License (CC-BY) which permits any use, distribution, and reproduction in any medium, provided the original author(s) and source are credited.
Funding/Manuscript writing assistance:
The authors have financial support or funding to report and they declare that no writing assistance was utilized in the production of this article.
Competing interest:
The authors have declared that no competing interest exist.
Article history:
Received 31 May 2019, Revised 23 June 2019, Accepted 25 June 2019.
Abstract
Complex parenteral dosage forms such as subcutaneous implants and liposomes are often associated with diffusion or erosion-based release mechanism of the drug product. One such formulation is INFUSE® Bone Graft. It involves release of a recombinant human bone morphogenetic protein (rhBMP-2) from a biodegradable absorbable collagen sponge (ACS) scaffold. In order to characterize the release of rhBMP-2 from ACS or other scaffolds in a biorelevant media, a simple, precise and accurate stability-indicating high-performance liquid chromatography (HPLC) method was developed and validated. The total run time of the method was 9 min, and the rhBMP-2 retention time was 3.44 min. The dynamic range of the assay was determined to be 0.50–100 µg/mL. The limit of detection (LOD and quantification (LOQ) were observed to be 0.18 µg/mL and 0.50 µg/mL, respectively. Reverse predicted residuals, inter-day accuracy and inter-day precision were all less than 10% including at the LOQ. Forced degradation studies revealed no chromatographic interference from excipients, media or degradant peaks. Mass spectrometric detection was used for further characterization of rhBMP-2 glycoforms in the formulation. Oxidation and deamidation were predicted as the most common degradation mechanism for the protein. The developed method was applied for studying release-testing samples from a novel biorelevant in vitro drug release model (BIVDR). In conclusion, the HPLC- based assay method can be used for studying rhBMP-2 concentrations released from an ACS scaffold in dissolution media.
Keywords
rhBMP-2, RPLC, Stability Indicating Method Validation.
1.0 Introduction
Bone morphogenetic protein-2 (BMP-2) is an osteoinductive and osteointegrating signaling molecule [1]. It is secreted in the human body as a glycoprotein and the molecular weight of its dimer isoforms are between 26-30kDa [1-3]. It belongs to the Transforming Growth Factor-β family of cytokines which are critical in cellular formation and differentiation, predominantly during the embryonic stages [4]. Recombinant BMP-2 in the past decade has largely been cloned in Chinese Hamster Ovary (CHO) cell lines. When applied as a formulation with a biodegradable scaffold at the trauma site, it helps in bone regeneration and healing. It has been used as an alternative to autograft bone for spinal fusions, healing of tibial fractures and sinus lift augmentation surgeries [3,5, 6]. Currently, one such FDA approved indication of recombinant human BMP-2 is INFUSE® Bone Graft (Medtronic, Minneapolis, MN, USA). The formulation is marketed as a combination of lyophilized powder of rhBMP-2, which has to be reconstituted with sterilized distilled water and an absorbable collagen sponge (ACS) [7]. After reconstitution at 1.5 mg/mL, the solution is distributed uniformly on the surface of the sponge. An initial period of 15-30 min is allowed for non-covalent binding of the rhBMP-2 protein to the collagen sponge. The final indication is then applied at the site of trauma or for oral surgery by the clinician [7]. Bone regeneration at the intended site (sinus lift, trauma or spinal fusion) occurs by controlled and extended release of the rhBMP-2 protein from the biodegradable scaffold (ACS).
‘Biorelevant’ in vitro dissolution or drug release tests act as a surrogate quality control tools for performance verification of the pharmaceutical formulation and ensures minimal inter-batch variability [8,9]. It helps in establishing clinically relevant specifications. These release tests for ‘novel’ formulations such as implants, help in investigating the effects of physiological variables on the release mechanism of drugs at the complex site of action. Additionally, these tests will assess and compare the in vitro release of rhBMP-2 to the available in vivo data, and ultimately establish an In Vitro In Vivo Relationship (IVIVR). In our in vitro studies, a biorelevant release media using modified Hank’s balanced salts solution (modified by removal of phenol red and sodium bicarbonate components) was used [10]. In order to analyze the rhBMP-2 release samples in biorelevant media, a reliable, precise, accurate and stability indicating high-throughput assay method was required. Previous measurements of rhBMP-2 relied upon enzyme-linked immunosorbent assays (ELISA). However, the limited linear range (62.5-4000 pg/mL) for the ELISA requires expansive dilutions (i.e., 104~106 dilution for release samples) and are not applicable to the release studies, which result in much higher concentrations (i.e., within our validated range of 0.50 – 100 µg/mL). Given that other early analytical work has shown the use of a reversed phase (RP) C4 resin for the extraction and purification of the rhBMP-2 protein from CHO cell lines, growing in cell culture media [11, 12], this offers a starting point to developing an RPLC-UV method.
The objective of this current paper is to develop and validate a stability-indicating HPLC assay method which is: a) time and cost effective, b) can be reliably used for direct analysis in the range (2-100 µg/mL) and c) the validated method must be able to quantify rhBMP-2 from ACS into release media or labeled claim of the active pharmaceutical ingredient. Validation of the developed method focused on evaluations of linearity, intra-day and inter-day precision, intra-day and inter-day accuracy, recovery, and system suitability. Effects of forced degradation conditions have also been assessed in this work, to detect the presence of any potential chromatographic interfering compounds in the formulation such as excipients and release media. Forced degradation studies involved studying effects of acid, base, oxidation, and temperature (thermal degradation) based stress conditions on the drug substance.
2.0 Materials and methods
2.1. Chemicals and reagents
INFUSE® Bone Graft components were donated by Medtronic (Minneapolis, Minnesota). HPLC grade Mobile phase components a) Acetonitrile was purchased from VWR (Radnor, PA), b) water from Fisher Scientific (Waltham, MA USA) c) trifluoro acetic acid (TFA) was purchased from EMD Millipore (Massachusetts). Modified Hank’s Balanced Salt Solution (without phenol red and sodium bicarbonate) [10] and 4-(2-hydroxy-ethyl)piperazine-1-ethanesulfonic acid (HEPES buffer, 1 mM) were purchased from Sigma-Aldrich (St. Louis, MO). Polyethersulfone syringe filters (0.45 µm, Whatman) that were used to filter the prepared modified HBSS were purchased from VWR (Radnor, PA). Protein biocompatible inserts for use in HPLC of rhBMP-2 samples were purchased from MicroSolv (Eatontown, NJ). ProteinLoBind tubes were purchased from Eppendorf (Hauppauge, NY). Agilent Zorbax 300-SB C3 column was donated by Agilent technologies. Phosphate buffer saline was obtained from Sigma-Aldrich (St Louis, MO).
2.2. Equipment and software
An Agilent 1260 Infinity HPLC was used for the method development and validation of rhBMP-2. The equipment consisted of modules of a thermostat controlled autosampler tray, a binary pump, and a photodiode array detector. Chemstation software (version: C.01.07) was used for the instrument control and data processing. The pH of the buffers and solution was measured using TruLab pH1310 (YSI, Inc., Yellowsprings, OH). The mass spectrometric detection/characterization of the peak-trapped samples before and after forced degradation were performed on an AB Sciex 4000 Qtrap (Framingham, MA) LC-MS/MS system. The software used for control and data acquisition was Analyst software (1.5.2). For protein deconvolution algorithm, BioanalystTM (1.4) – Bayesian protein reconstruct tool was used.
2.3. Preparation of Mobile Phase, Stock Solutions, Calibration Standards And Quality Controls
The aqueous mobile phase consisted of water with 0.1% TFA and the organic mobile phase consisted of 90% acetonitrile with 0.1% TFA. Hanks Balanced Salts Solution (HBSS) is a media, which has often been used in tissue culture and has comparable ion concentration and osmolality to human plasma [10]. Hence, it was selected to simulate biorelevant release media conditions [10,13]. As previously shown [10], Modified HBSS was prepared by addition of 9.8 g of HBSS powder to 975 mL of water and 25 mL of 1M HEPES [10]. rhBMP-2 protein has been shown to be most stable at a pH of 4.5 (reduced aggregation and denaturation [14]) and hence the pH was adjusted for sample injection. After preparation, the solution was filtered through a 0.45 µm filter and stored at 4°C. Stock solutions of 200 µg/mL, 100 µg/mL, and 10 µg/mL were prepared in the biorelevant release media to cover the entire range of the calibration curve from 0.5 µg/mL -100 µg/mL. A series of calibration curves were prepared with nine calibration levels equally distributed throughout the dynamic range: 0.5, 1.25, 1.5, 5, 10, 25, 50, 75, and 100 µg/mL respectively. Quality control standard levels were selected bracketing the expected release range at 7.0, 20 and 45 µg/mL respectively and the LLOQ at 0.5 µg/mL and prepared from a separate stock solution than what was used for the calibration curves. Minimal sample preparation step was required (i.e., vortex and centrifugation). The release samples were thawed to room temperature, vortexed for 1min, centrifuged on a tabletop centrifuge and aliquoted into biocompatible inserts for injection.
2.4. Chromatographic Method Development Conditions
In silico characterization of rhBMP-2 was initiated using the sequence of the dimer for human BMP-2 from UniProt to evaluate hydrophobicity [15]. ExPaSy ProtParam by SwissProt was used as a software tool for a baseline theoretical prediction of the physicochemical characteristics such as isoelectric point (pI) and hydropathicity [15,16]. Chromatographic retention of a protein can be significantly affected by its hydrophobic nature and dimension. A grand average of hydropathicity (GRAVY) score of -0.56 and pI of 8-9 was calculated by ProtParam [15]. Hence taking into consideration the hydrophobicity of the protein, the size of the dimer molecule, and pI of the protein, an HPLC column with the following parameters was selected: a C3 column, 250 mm x 2.1 mm, 5 µm, 300 Å was selected (Agilent Technologies, Santa Clara, CA).
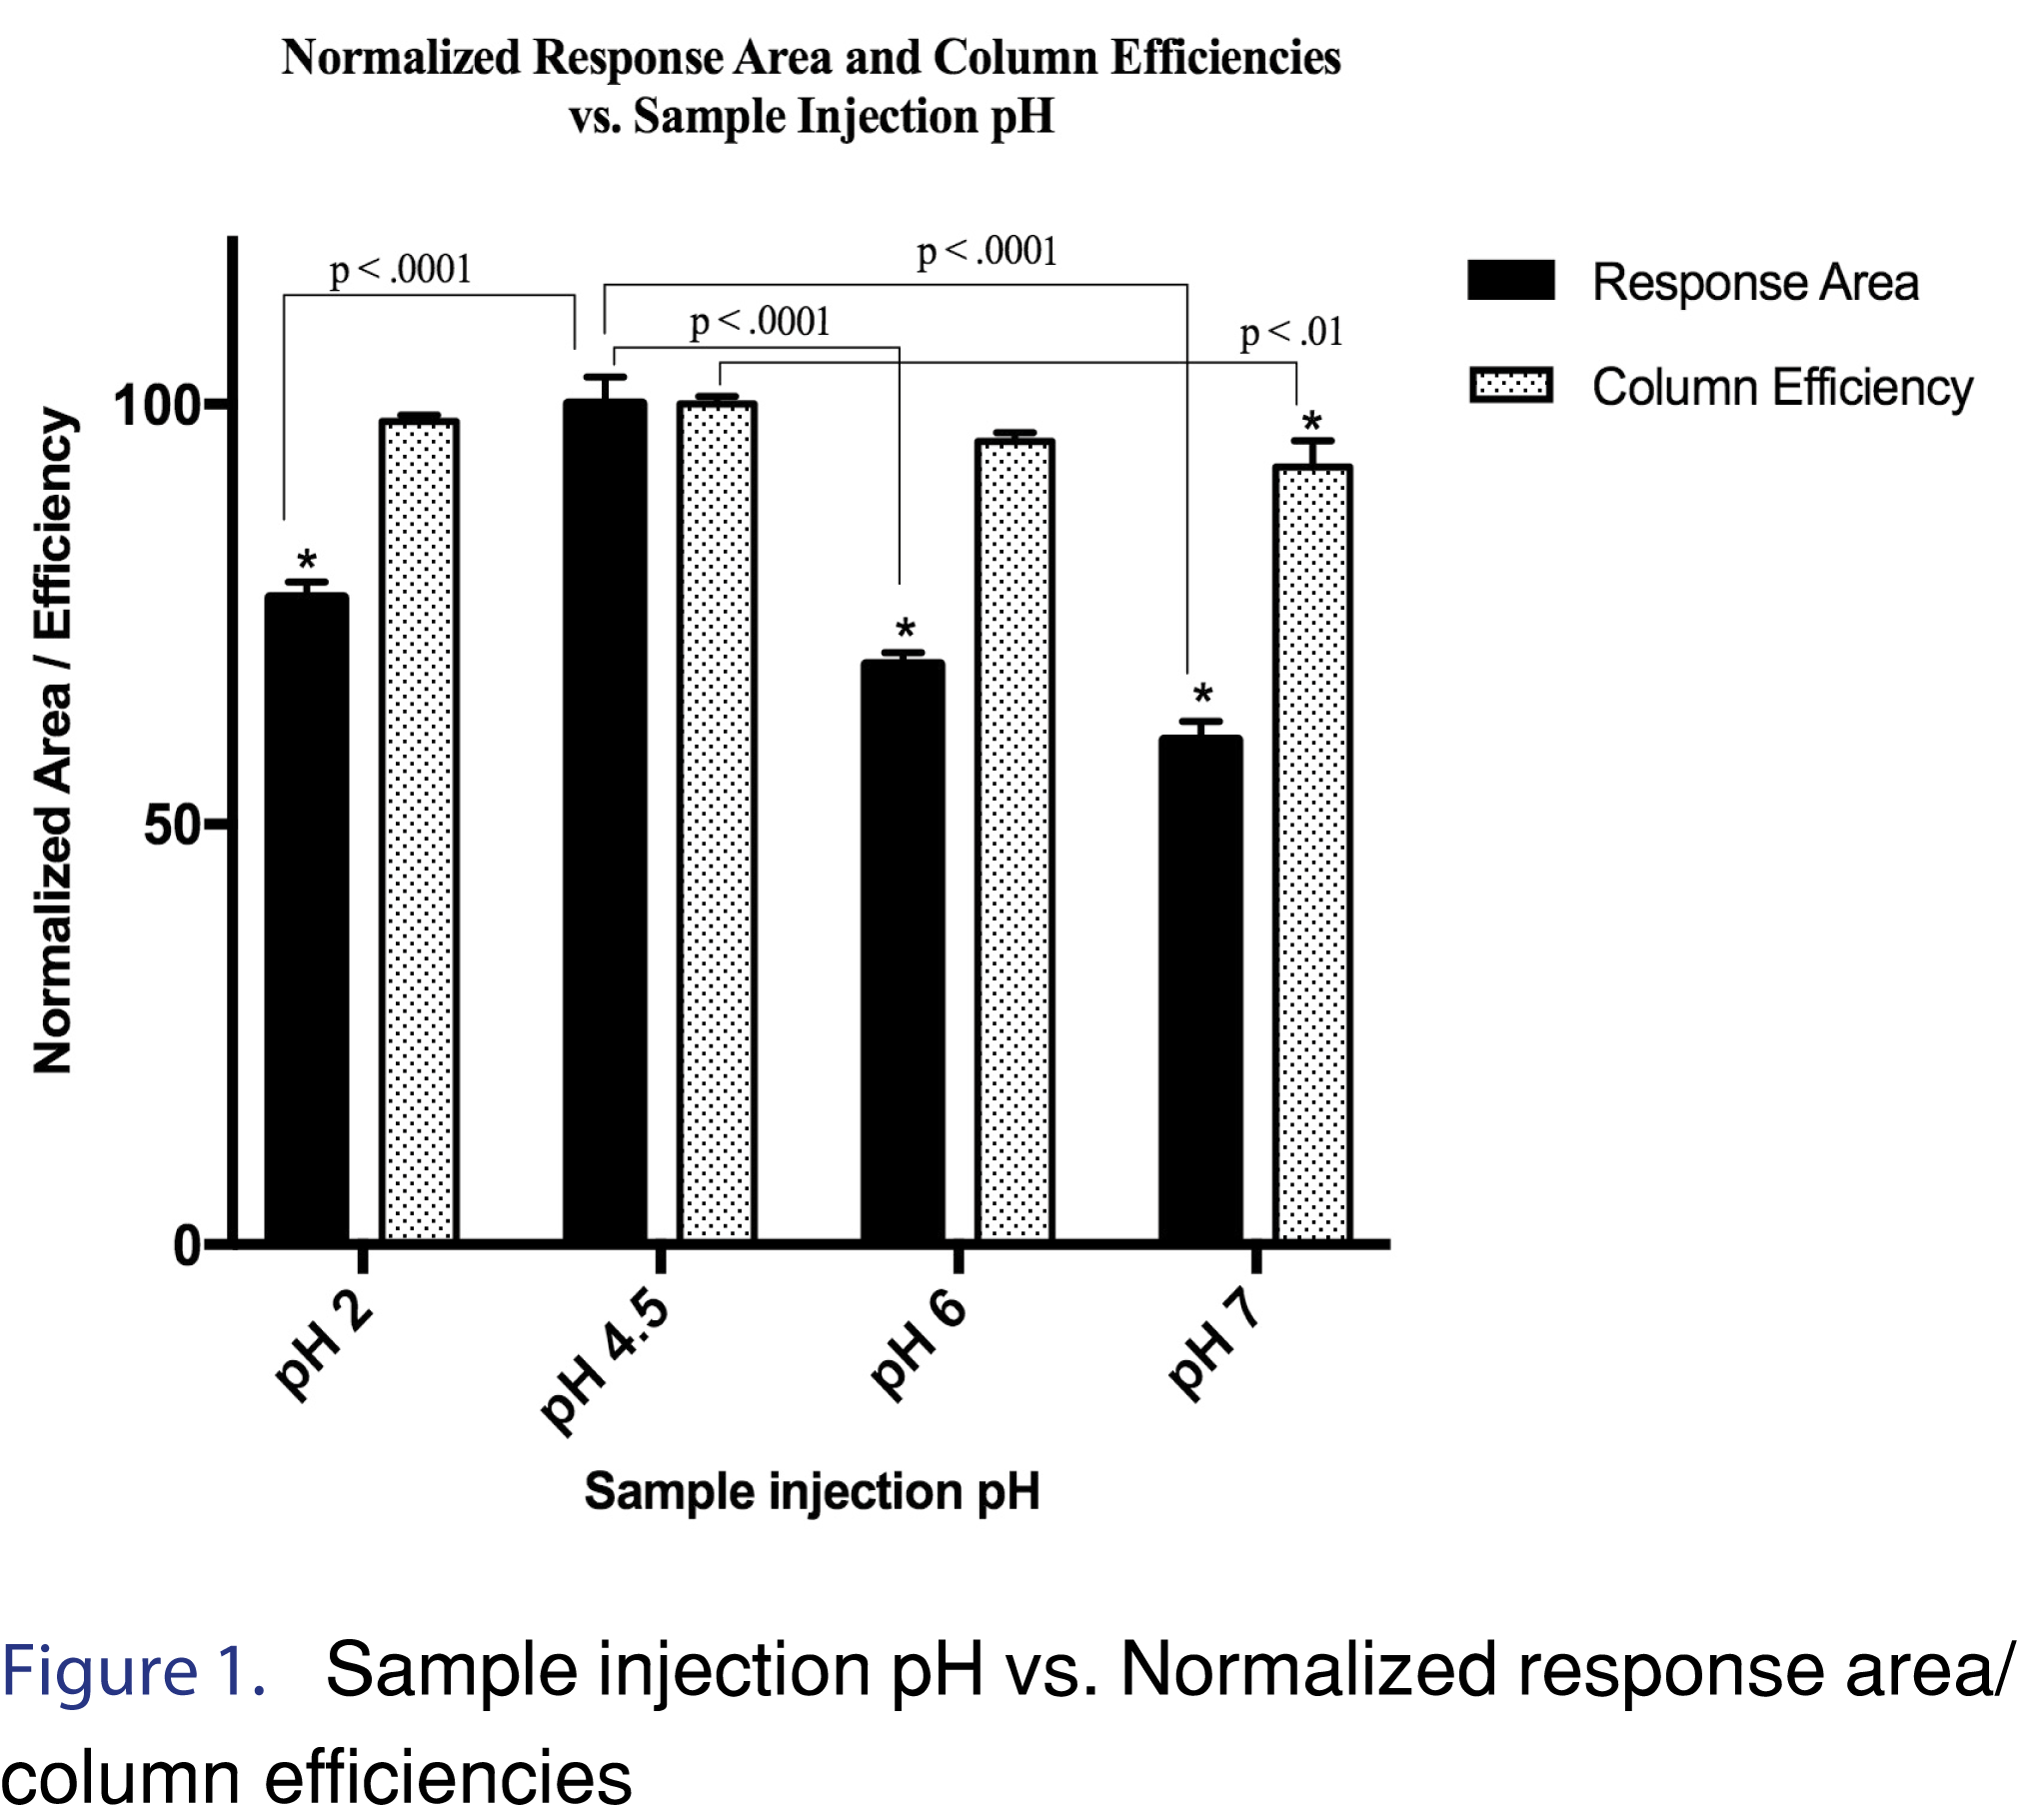
Method development and optimization studies entailed sequentially evaluating the process variables based on the peak area response, column efficiency, peak shape, and robustness. Crucial optimization parameters that were assessed were: a) gradient profile adjustment to reduce the retention time, b) combination of optimal velocity (i.e., flow rate) to minimize band broadening c) sample injection pH d) sample volume and e) column temperature. Recombinant human BMP-2 has been found to be sensitive to pH changes. In the body, it is released at the site of fracture healing as a chemotactic and osteoinductive agent in an acidic pH microenvironment [17,18]. An in-depth pH study relative to the physical stability and conformation maintenance of rhBMP-2 in Luca et. al shows that the aggregation and denaturation behavior of rhBMP-2 depends heavily on it’s media pH [14]. Therefore, pH studies with respect to response area and column efficiency were critical for analysis reproducibility. Since pH 4.5 gave the best results, the response area and column efficiencies at pH 2, 6 and 7 were normalized with respect to values at pH 4.5. The column efficiencies in all cases were > 2000 as required by USP guidelines [19]. Results of pH vs. normalized response area percentage and normalized column efficiency percentage have been shown in Figure 1. Diode array detection wavelength for rhBMP-2 was selected by optimization of a combination of factors: a) wavelength (202 nm-220 nm), b) bandwidth (4 nm-20 nm) and c) reference wavelength (280 nm-360 nm). These parameters were finalized based on a good signal to noise ratio, rhBMP-2 peak shape, and optimized resolution between the drug product and major degradant peak during forced degradation stability analysis. Recovery studies were also performed in water and phosphate buffered saline (PBS) and compared to biorelevant media. Peak purity analysis was performed using Chemstation software (Version: C.01.07) and the threshold for passing peak purity was 990 out of 1000 for a pure peak.
2.5. Method Validation
The method was validated similarly to the FDA Bioanalytical guidelines [20, 21] due to Hanks’ balanced salts solution plasma simulation [10] and it being a cell culture medium. Quality control sample concentrations were selected based on preliminary results of release testing. Validation experiments consisted of selectivity, linearity, precision and accuracy, recovery, and limit of quantification. Six calibration curves were prepared and evaluated for linearity. A polynomial regression model (R2 >0.99) with least squares regression was used for the calibration curve based on chromatographic peak area vs. concentrations of the drug substance. The simplest model was chosen based on the accuracy data of the calibration points (i.e., back-calculated values), The limit of detection was calculated using five times the signal to noise ratio. Furthermore, the limit of quantification was evaluated as ten times the signal to noise; however, a higher experimental value, which could be reliably and repeatedly quantified with an accuracy of 80-120 % and a relative standard deviation (RSD) of <15% was selected (0.5 µg/mL). Intra-day and inter-day precision and accuracy were calculated for three batches (n=9). System suitability (SST) was evaluated using (n=6) replicate injections of rhBMP-2 at a concentration of 20 µg/mL. Criteria for passing SST was 2% relative standard deviation percentage for precision, column efficiency (>2000), and a tailing factor <2, according to USP guidelines for method validation of chromatographic methods [19]. Recovery studies were performed in water and PBS and also in modified HBSS by spiking pre-analyzed QC samples with known concentrations of the drug substance.
2.6. Stability Of rhBMP-2
Proteins tend to aggregate at low concentrations and are highly labile to minor fluctuations in temperature; therefore, evaluating the stability of rhBMP-2 was critical for the in vitro release experiments. Stability studies were carried out at two different concentrations (2 µg/mL and 15 µg/mL, respectively), three different temperatures (i.e., 4°C-autosampler temperature, 22°C-room temperature, and 37°C-physiological body temperature). Incubation was performed at two-time points: 12 h and 24 h, respectively. Storage stability and freeze-thaw cycle stability studies (1 and 2 cycles) were also carried out at -20°C and -70°C, respectively.
2.7. Stability Indicating Method Conditions
Stability studies are a crucial part of method validation studies to determine the presence of interfering degradant products, which might appear in the formulation during bioprocessing, storage, handling, and/or transportation. They also shed light on the degradant detection and resolution ability of the optimized method. Therefore, it is necessary to investigate the stability of rhBMP-2 in the biorelevant media during the in vitro release testing process. The conformation and stability of a protein are a measure of its therapeutic value [22]. Stress testing for the drug substance was performed using acidic (0.1M HCl), basic (0.1M NaOH), oxidative (i.e., peroxide-30%) and temperature (70°C) at 24 h, 48 h, and 72 h stress conditions, respectively at a concentration of 45 µg/mL. Since no degradation products were observed initially with the method’s 9min run time, the run time was increased to 20 min to help in the detection of possible late eluting degradation products [19].
2.8. Differential Isoforms of recombinant human Bone Morphogenetic Protein-2 (rhBMP-2)
rhBMP-2 is a chemo-attractant molecule that is both osteoinductive and osteoconductive [23]. Endogenously, it attracts the mesenchymal stem cells to the site of trauma and injury to facilitate the process of bone regeneration. rhBMP-2 is most commonly cloned in Chinese Hamster Ovary(CHO) cell lines. Since the folding and conformation of a protein is central to it being therapeutically bioactive, CHO cells are adept at post- translationally processing the BMP-2 homodimer [24]. This results in six distinct isoforms of BMP-2 each of which can have varying combinations of 5-9 mannose units per monomer attached to its N-linked glycosylation site [11]. Each monomer of rhBMP-2, depending upon its post-translational processing, could either begin with a glutamine at position 283 (Q283) or with an additional 17 amino acids with a threonine at position 266 (T266). Glutamine conversion to pyroglutamate at physiological pH and in solution at the N-terminal end is often observed in proteins and hence also in rhBMP-2. The glutamine undergoes cyclic conversion to pyroglutamate (Q’283) leading to a loss of -17.03 Da [25]. However, since the rhBMP-2 is a dimeric molecule, about 6 different isoforms are possible. Each of these isoforms can, in turn, contain a combination of 5-9 mannose residues on each of the monomer, giving rise to heterogeneity and complexity in the protein. All the post-translationally modified isoforms of rhBMP-2 are found in the drug formulation and have comparable bioactivity and bone induction ability as evaluated in Porter et. al. [26].
2.9. Qualitative characterization of rhBMP-2 glycoforms and forced degradation products using mass spectrometry
An exploratory mass spectrometry survey was carried out on the peak-trapped samples from the HPLC, for qualitative characterization of the changes affecting the rhBMP-2 molecule. The rhBMP-2 drug product (both non-stress treated and stress treated (as mentioned in section 2.7) samples were injected into the Agilent 1260 Infinity HPLC at a concentration of 45 µg/mL. The rhBMP-2 peak, degraded peak 1(DP1) and degraded peak 2(DP2) (as shown in Figure 4A-D) were peak trapped and collected in low protein bind eppendorf tubes. These were injected by direct infusion at 15 µL/min into AB Sciex 4000 Qtrap mass spectrometer. The difference in molecular weights (based on m/z) between the control samples (samples which had not been subjected to stress/forced degradation) and peaks trapped from acid, base, peroxide and temperature subjected stressed samples were investigated. An Enhanced Multi-Charge (EMC) scan mode was selected over a Q1 MS mode during mass spectral characterization since rhBMP-2 drug product is a relatively large protein molecule (29 kDa-32 kDa) which acquires multiple charges during the ionization mode and has multiple isoforms. The EMC scan mode in 4000 Qtrap facilitates the transfer of multi-charged ions only and the low charged ions escape out of the linear ion trap (LIT) during the set delay time. Although there is some loss of multiply charged ions during this delay time; the loss of singly charged ions are much more in relative comparison. A scan range of 1200-2800 m/z was selected. Q0 trapping was switched on and LIT fill time of 10ms was applied as well as a Q3 empty time of 30 ms. The MCS barrier was set at 3V; declustering potential at 57V and collision energy at 55V. Infusion rate was set at 15 µL/min. Since the formulation is a complex mixture of isoforms of the protein, initial tuning of the method was focused on acquiring a maximum of signal/noise ratio and reproducibility for the dominant ions. The mass spectra were deconvoluted using Bioanalyst software and the Bayesian protein reconstruct algorithm. The deconvolution results were then interpreted using the GlycoMod tool of ExPASy (SIB Bioinformatics Resource Portal) to calculate the number of mannose units present on the intact protein [27].
3.0 Results and discussion
3.1 Method development
A stepwise gradient profile was used with the following conditions: initially at 70%- 0.1% TFA (Mobile Phase A) and 30%- 90% acetonitrile with 0.1% TFA (Mobile Phase B; followed by 0.2-1.7 min. increased to 85% Mobile phase B; 3.5 – 5 min. at 95% (Mobile phase B); and finally, 7-9 min. re-equilibration at initial conditions (70% Mobile Phase A). The gradient was run in a combination with velocity between 0.4 mL/min to 0.5 mL/min with a total run time of 9 min and an rhBMP-2 peak retention time of 3.44 min. The run time was kept longer to ensure a robust method was in place for release studies. The pH of the media is crucial to the stability of rhBMP-2, chromatographic studies were conducted for improvement of peak shape, peak area response and column efficiency with injection sample pH at 2 (pH matching with mobile phase pH 2), 4.5, 6 and 7.4. Figure 1 shows the normalized response area and column efficiency vs. sample injection pH. It was observed that the optimal peak shape, area response and column efficiency during the optimization studies were at pH of 4.5. A one-way ANOVA was performed with Dunnett’s multiple comparisons test. Since pH 4.5 showed the best response area and column efficiency mean values, it was used as the control column for multiple comparisons in the Dunnett’s test. The results were reported as normalized percentage for both peak area response and column efficiency.
The normalized mean peak response area for n=6 samples at pH 2.0 was 76.8 ± 1.8%, at pH 4.5-recorded mean was 100.0 ± 3.3 %, at pH 6 the response area showed a considerable decrease to 69.0 ± 1.4, and with a further reduction at pH 7.4 to 60.0 ± 2.2. Results of the ANOVA multiple comparison Dunnett’s test showed that response area at pH 4.5 was significantly different from each pH at 2, 6 and 7.4 at a significance level of α=0.01 with (p< 0.01). The normalized percent average column efficiency calculated for n=6 samples were 97.96 ± 0.70 for pH 2; 100 ± 0.93 for pH 4.5; 95.58 ±1.07 for pH 6 and 92.51 ± 3.12 for pH 7.4. A one-way ANOVA was used with a multiple comparisons Dunnett’s test to evaluate if the mean column efficiencies were significantly different from pH 4.5. It was found that the mean of pH 4.5 was significantly different from pH 7 at a significance level α=0.01 (p< 0.01).
Peak shape, response and column efficiency with respect to column temperature was evaluated at 25°C, 37°C, 40°C and 50°C. Optimal peak shape and response area was observed at 40°C. Sample injection volume studies were also conducted with injection volumes of 15, 20, 25, 35, 45, 55 and 60 µL in a 120 µL sample loop. Ultimately, a 60 µL injection, with minimal carryover at the higher limit of quantification, was used to obtain a linear dynamic range (0.50 to 100 µg/mL). For the DAD a wavelength of 217 nm, a bandwidth of 14 nm and a reference wavelength of 280 nm was selected to get a robust peak shape and sufficient resolution between the rhBMP-2 peak and degradant product 1 (dp1).
Figures and Tables
[Click to enlarge]
3.2 Method validation
3.2.1 Selectivity, Linearity, Limits of Detection (LOD) and Limits of Quantification
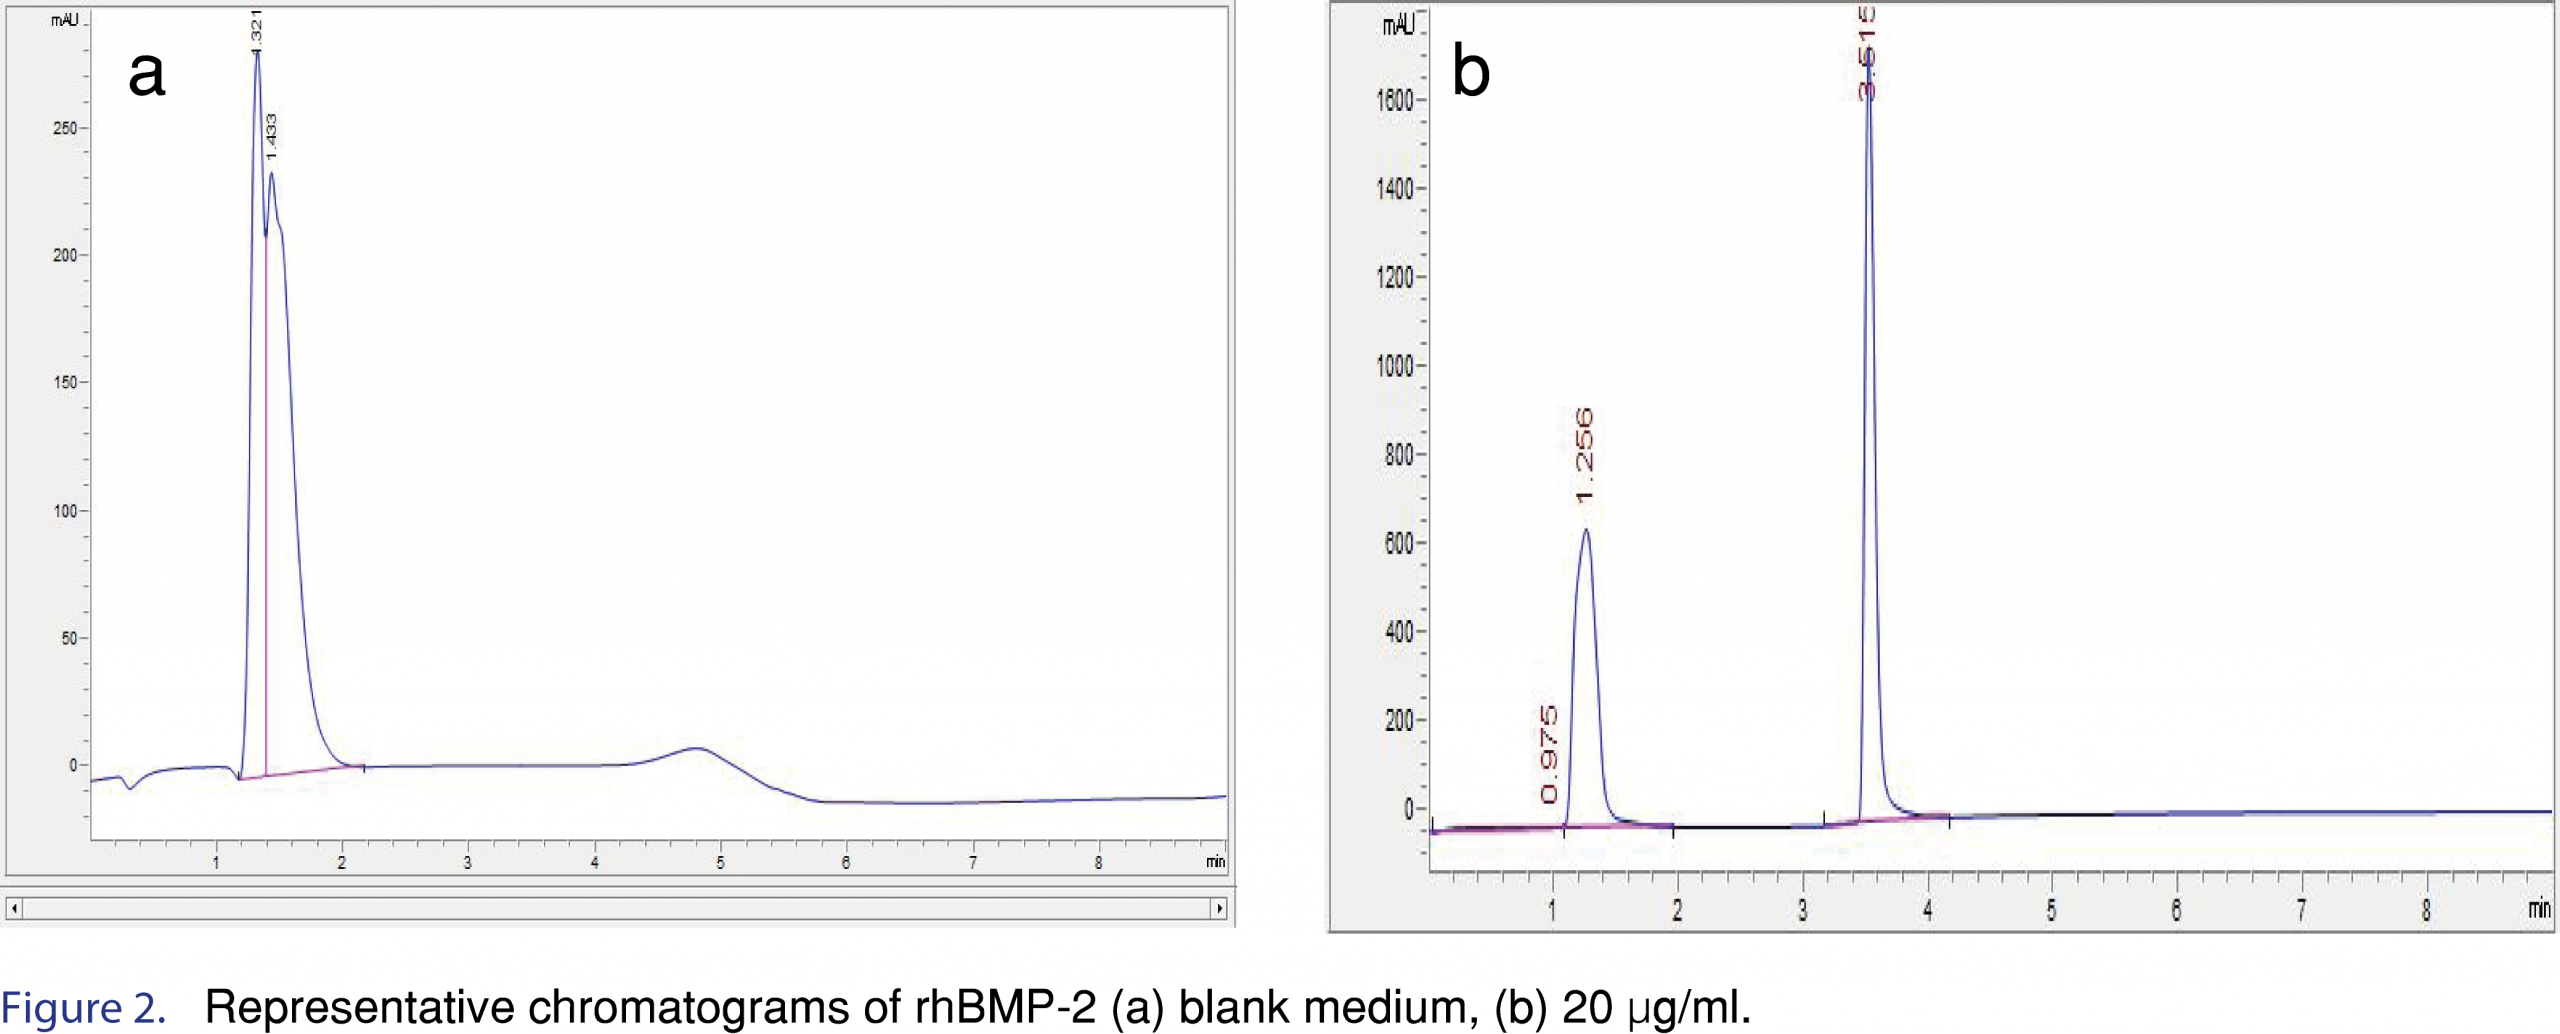
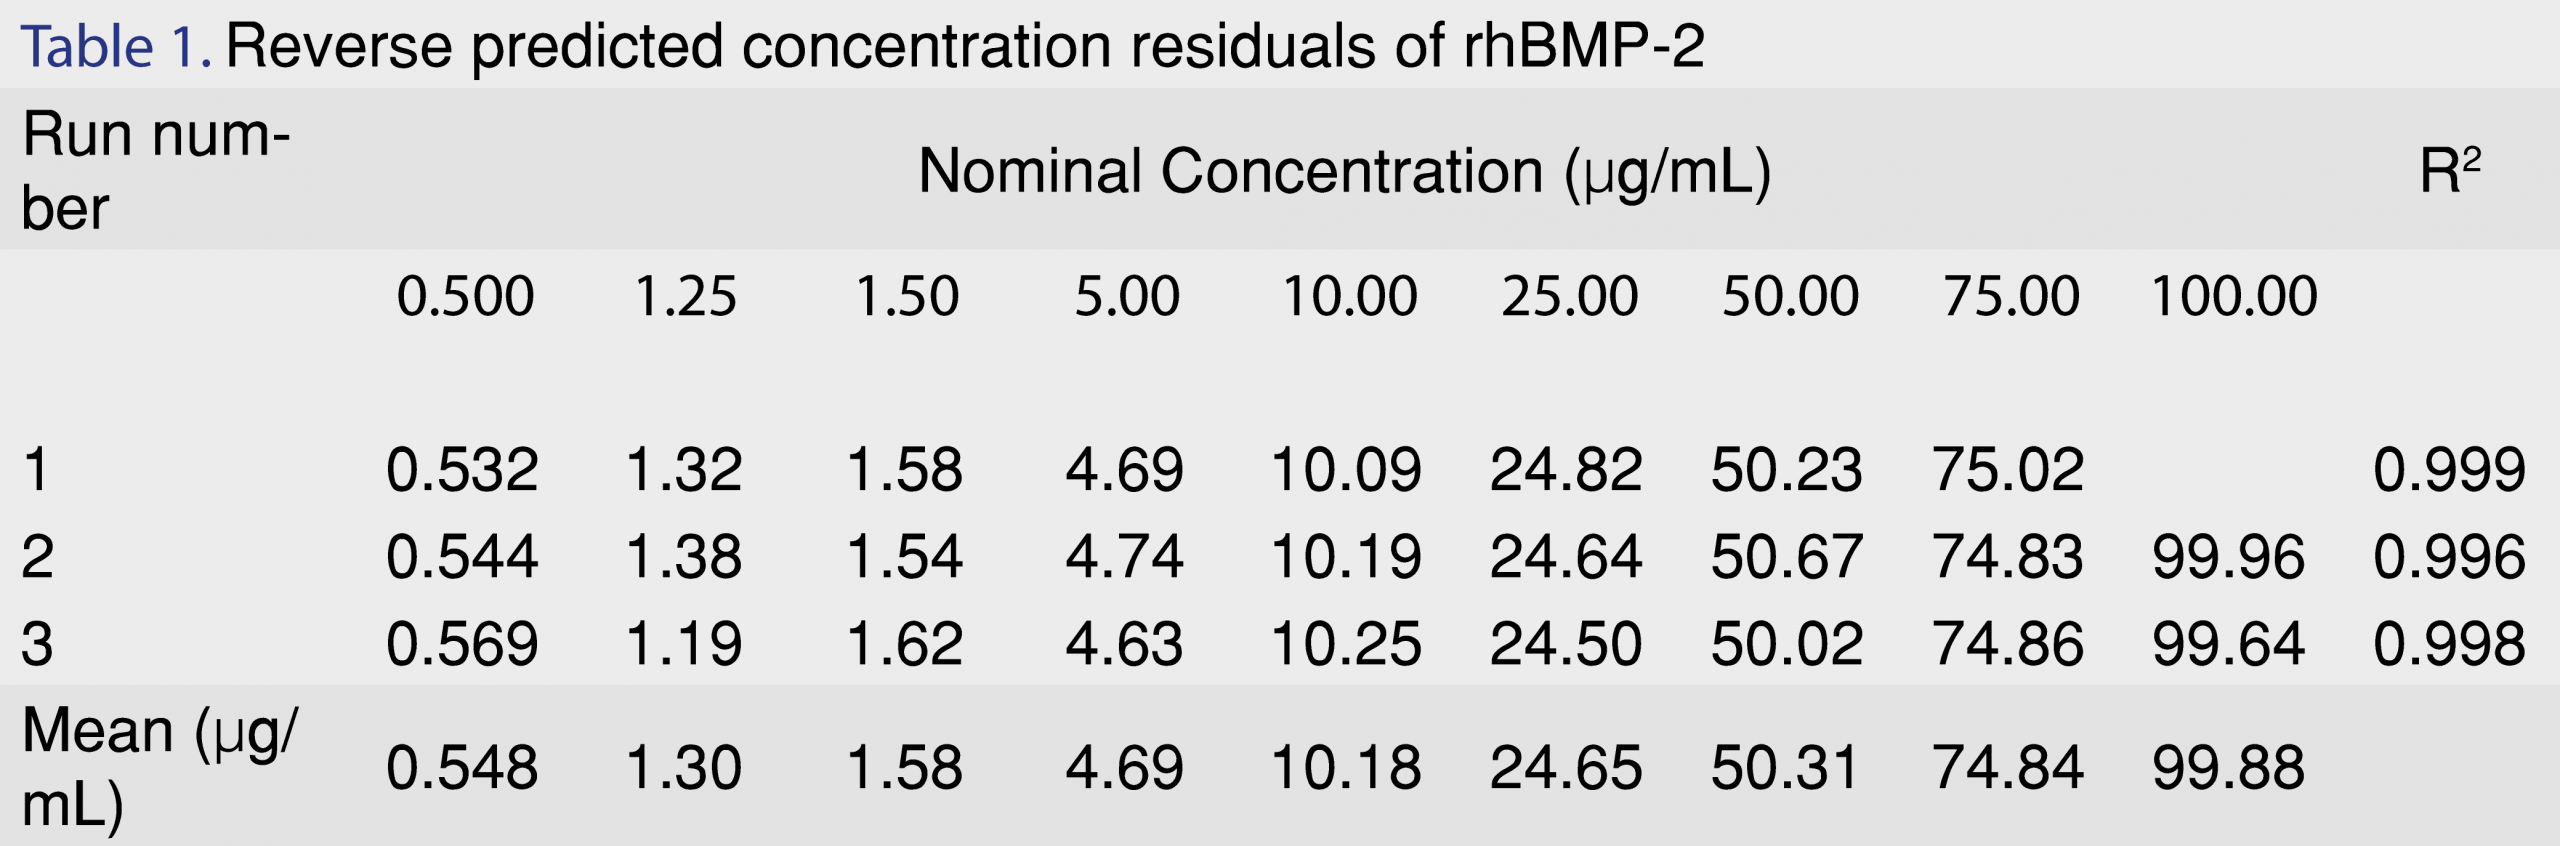
Selectivity for the assay was determined by testing if the formulation excipients interfered or had a similar retention time as the rhBMP-2 on the HPLC system. Each 1 mL of Infuse Bone Graft formulation consists of 1.5 mg of rhBMP-2 protein; 0.1 mg sodium chloride; 5.0 mg sucrose; 25 mg glycine; 3.7 mg L-glutamic acid and 0.1 mg polysorbate 80 [7]. Individual solutions of the excipients were prepared at the concentration that they are present in the original formulation as well as a mixture of all the excipients but without rhBMP-2 and injected into the column to observe the presence of interfering excipient peaks in the HPLC method. No interfering peaks were observed from any of the excipients. Peak purity evaluations with a cut off at 990 out of 1000 resulted in a peak purity similarity factor of 997 out of 1000; therefore, the peak was pure as by spectral comparison. Linearity was shown plotting concentration of rhBMP-2 vs. peak area response. Figure 2 is a representative chromatogram of a blank sample (A) and a 20 µg/mL concentration sample (B). A polynomial regression model was chosen for three runs (n=6), R2 >0.99. The reverse predicted residuals from the calibration curve have been provided in Table 1. The concentration of the reverse predicted residuals have been reported as percent difference from nominal (%DFN) and ranged from 9.67% at the LLOQ of 0.5 µg/mL to – 6.27%. The LOD was calculated as five times the signal/noise ratio and was found to be 0.18 µg/mL.
3.2.2. Intra-day and Inter-Day Precision and Accuracy
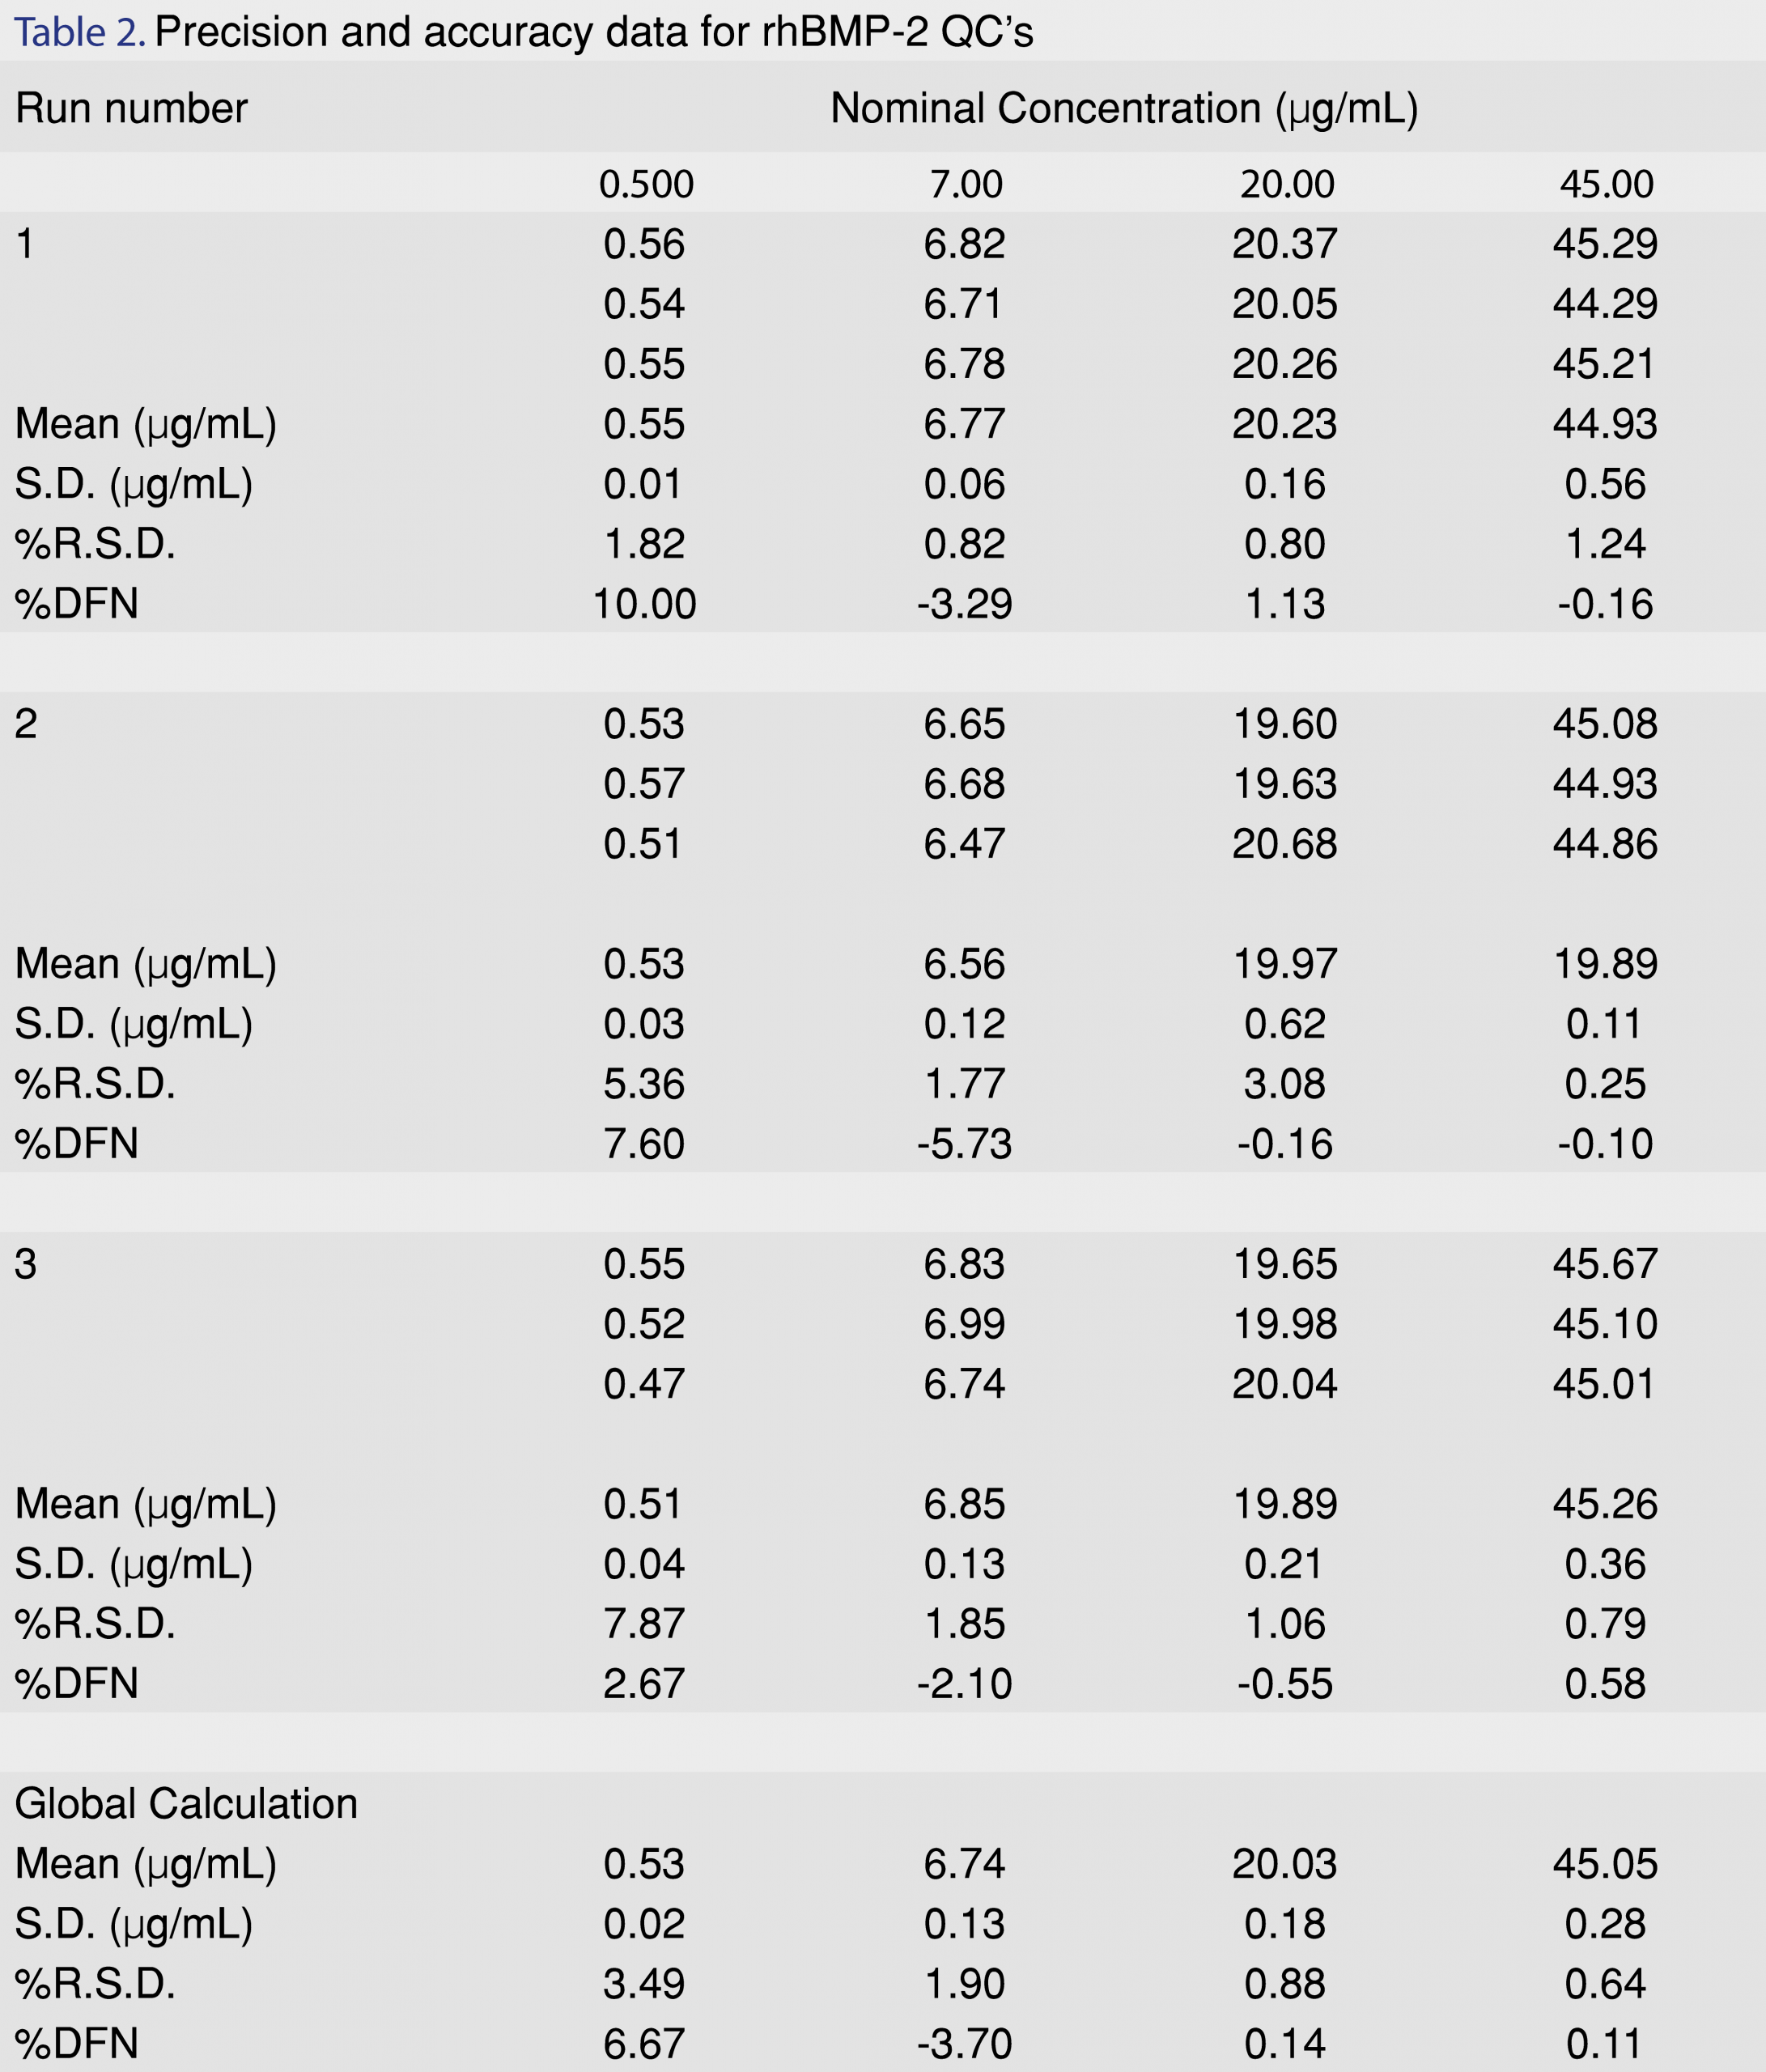
Precision and accuracy of the method are reported in Table 2 as %RSD and %DFN respectively. Inter-day and intra-day precision for the QC’s were carried out at three different levels (7 µg/mL; 20 µg/mL and 45 µg/mL) for release concentrations which were pertinent to release from the biorelevant model. A global calculation for the three different QC levels, for three runs (n=9), was estimated. %RSD was found to be from 0.64% to 1.90%. %DFN was observed to be between -3.70% to 0.14%. Precision and accuracy of the rhBMP-2 protein was also evaluated for the LLOQ at 0.5 µg/mL. Estimation of global calculation for the LLOQ (0.5 µg/mL) for all the three runs showed a %RSD of 3.49% and %DFN of 6.67%, respectively. Precision and accuracy for the individual inter-day runs have also been presented in Table 2.
3.2.3. System Suitability and Recovery
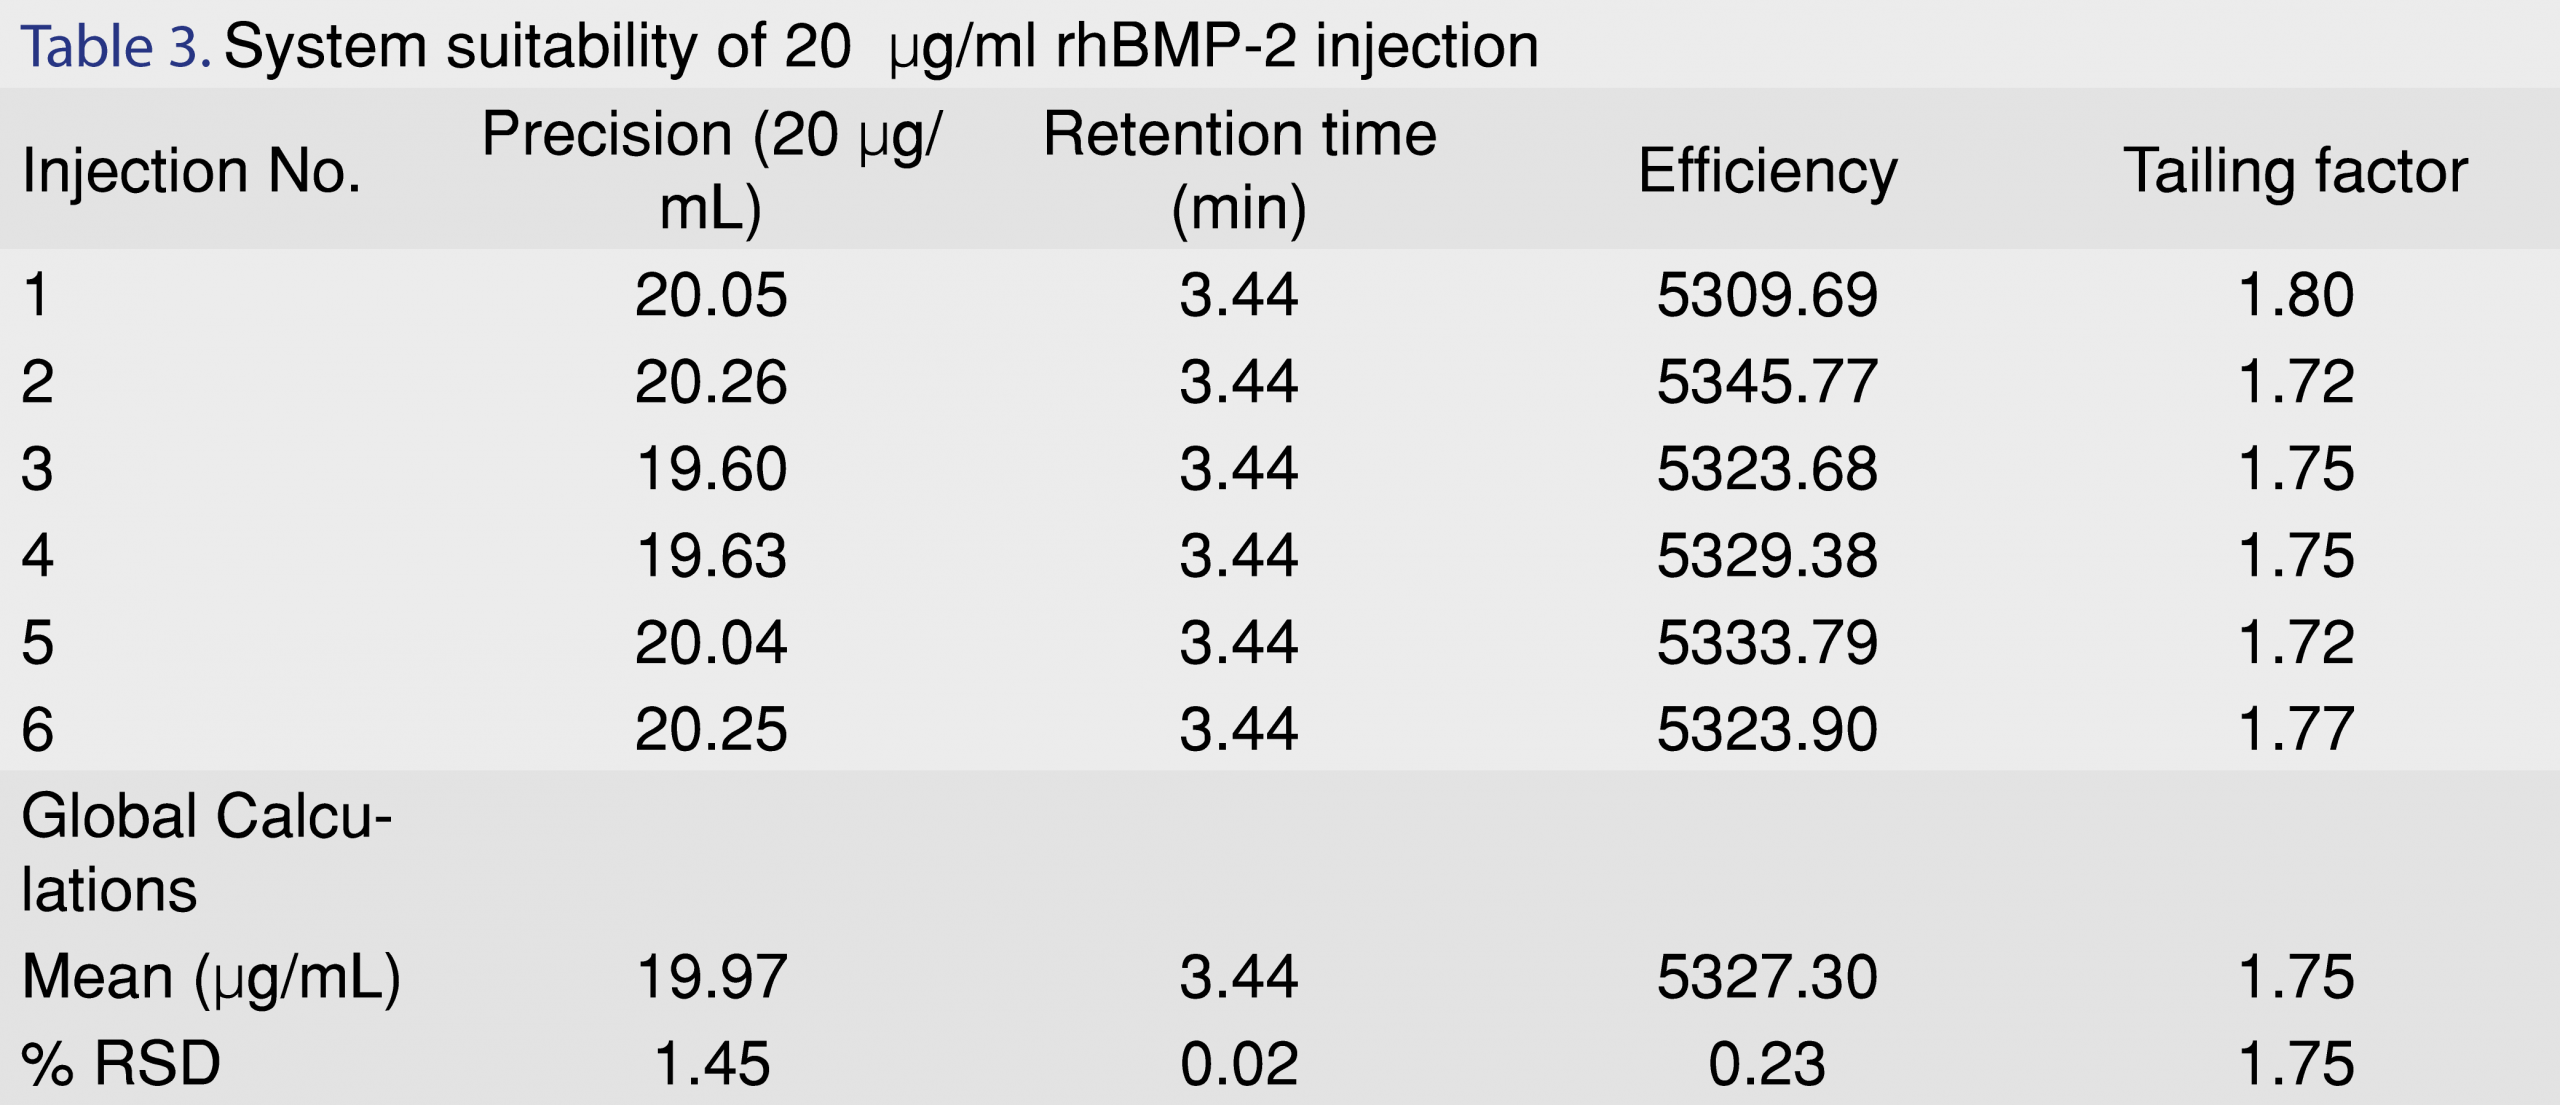
System suitability helps to establish the appropriateness of the developed analytical method with respect to the chromatographic modules used on a routine basis. For the developed rhBMP-2 method, system suitability was evaluated at a concentration of 20 µg/mL with 6 replicate injections (n=6). Results of system suitability have been shown in Table 3. A global calculation was performed for all the injections and was reported in terms of mean and %RSD for all the parameters such as precision, retention time, efficiency and tailing factor. The %RSD on precision was found to be 1.45%; retention time 0.02%; column efficiency 0.23% and tailing factor 1.75%. The validated analytical method developed for rhBMP-2 in biorelevant media was also tested for recovery of rhBMP-2 drug in water: ACN (70:30) and Phosphate Buffered Saline (PBS). Known concentration samples (20 µg/mL) were spiked with 3 µg/mL of rhBMP-2 protein (n=3 replicates). a) Water: ACN (70:30) showed a recovery% of 87.1 ± 0.2 b) PBS showed a recovery % of 100 ± 6.9 and c) in modified HBSS a recovery % of 102 ± 4.1 were observed.
3.2.4. Stability of Drug Substance
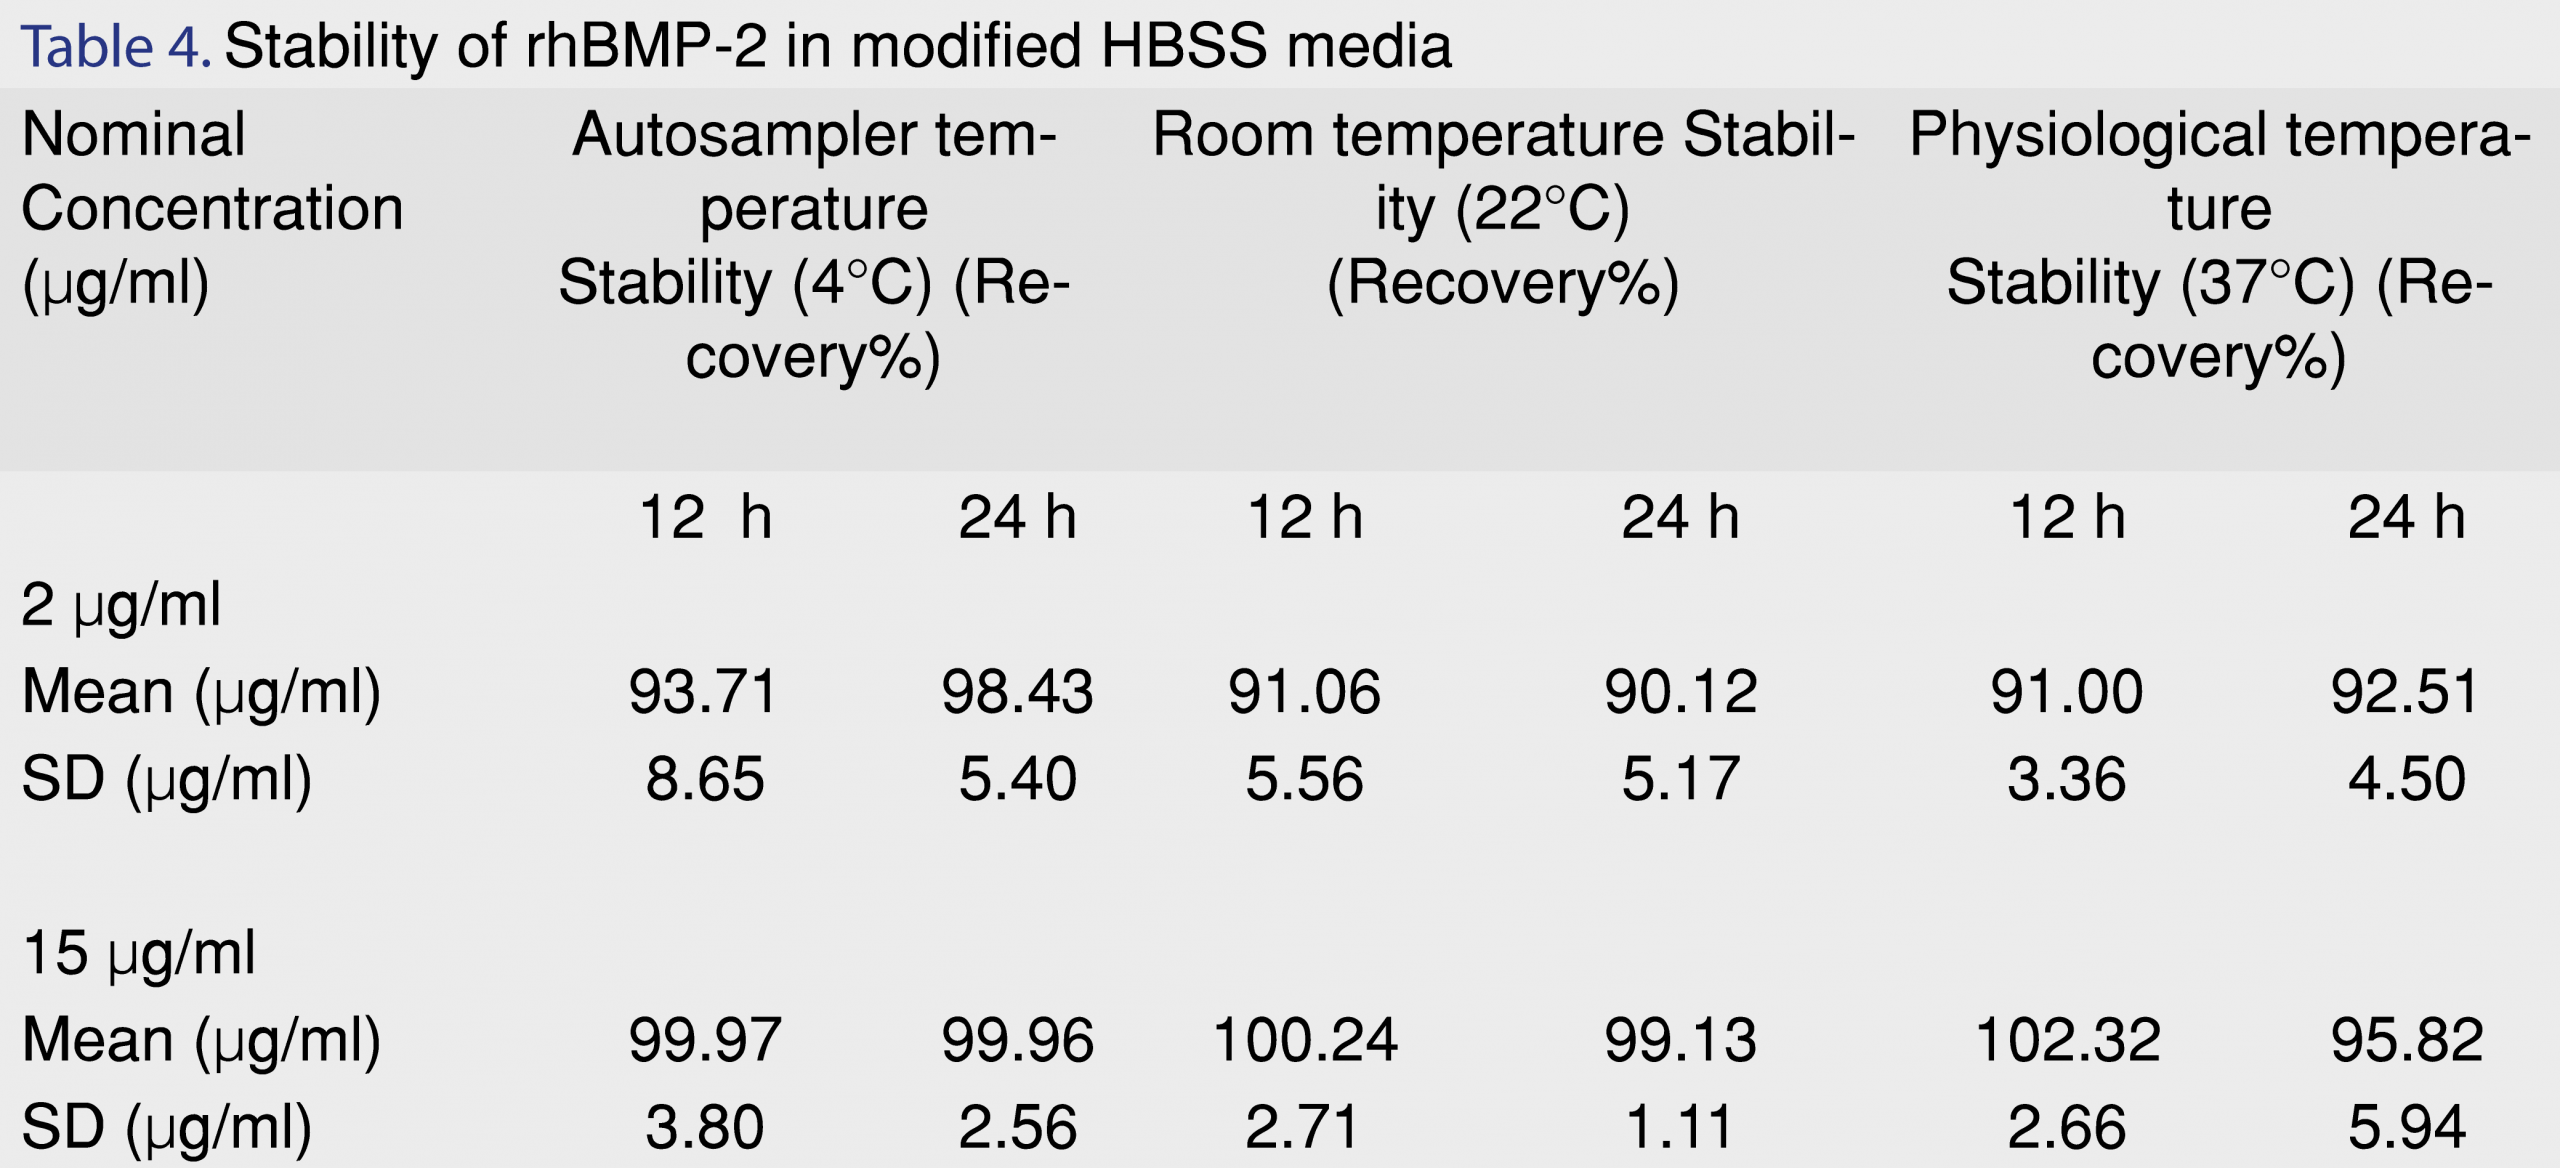
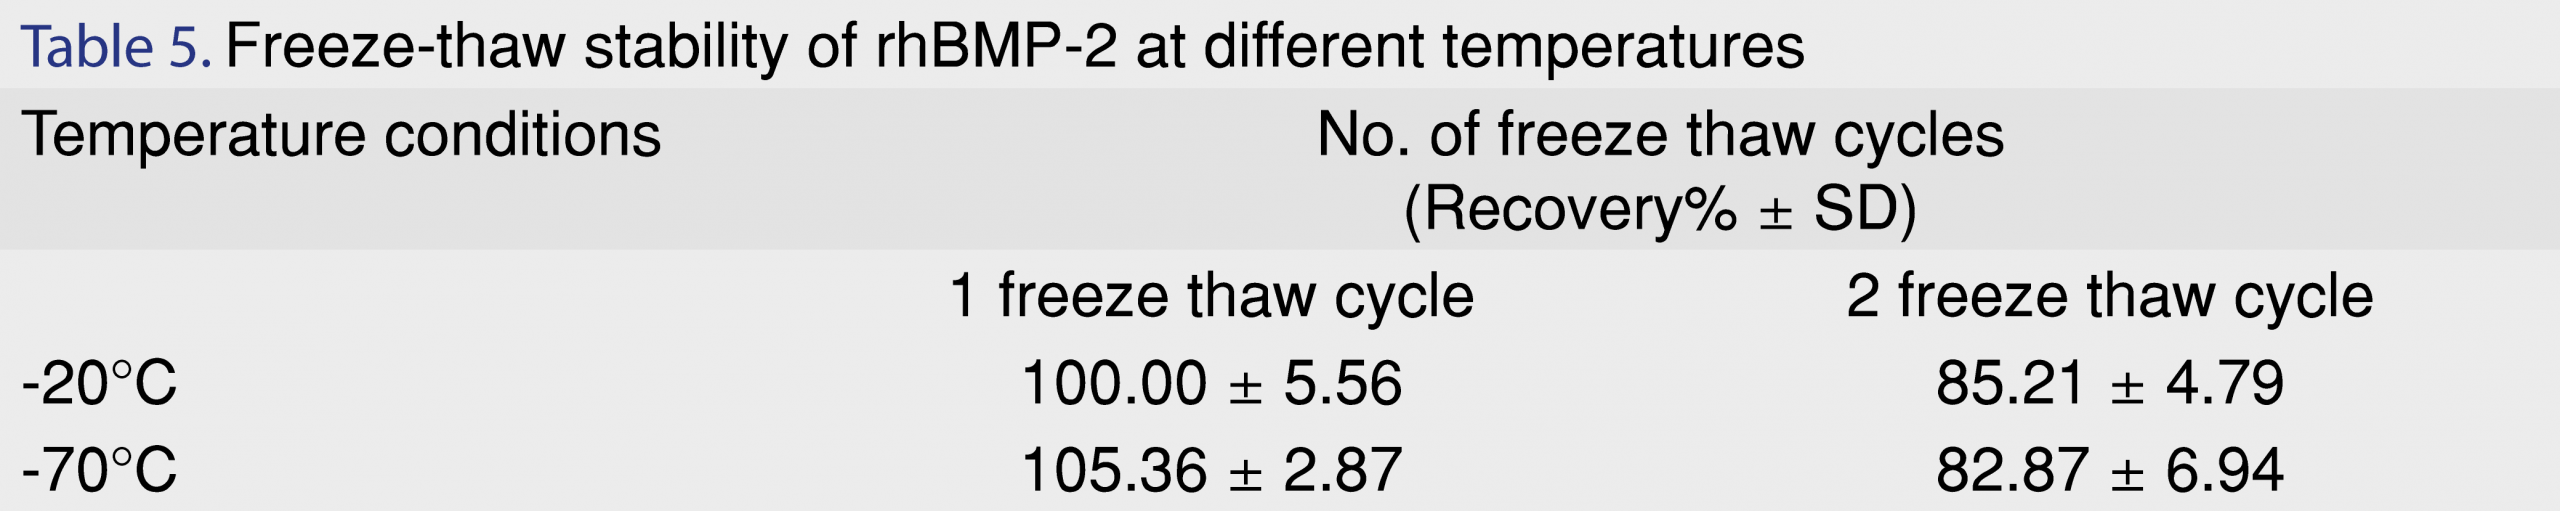
Stability was evaluated at low and medium concentration levels (i.e., 2 µg/mL and 15 µg/mL) and the data are shown in Table 4. Samples were stable when kept at 4°C (autosampler temperature), 22°C (room temperature) and 37°C (physiological body temperature). Percent recovery of the samples was within the acceptable range of 90-110% for a period of 24 h. Protein conformation (secondary and tertiary folding) stability has been known to be effected by freeze-thaw cycles, thereby leading to protein denaturation and aggregation [28,29]. Hence, freeze-thaw stability of the samples was evaluated at the primary storage temperatures for the samples (-20°C and -80°C). The results for n=3 replicate samples are shown in Table 5. Although the accuracy after one freeze-thaw cycle was within 10%, accuracy after two freeze thaw cycles in both -20°C and -80°C indicated a reduction by 14.8% and 17.1%, respectively. To reduce the need for more than one freeze-thaw cycle for future use, the stock samples when required to be stored in solution form, were aliquoted into separate protein loBind tubes at low volumes for storage (0.100 mL).
3.3. Stability Indicating Studies-Forced Degradation Analysis
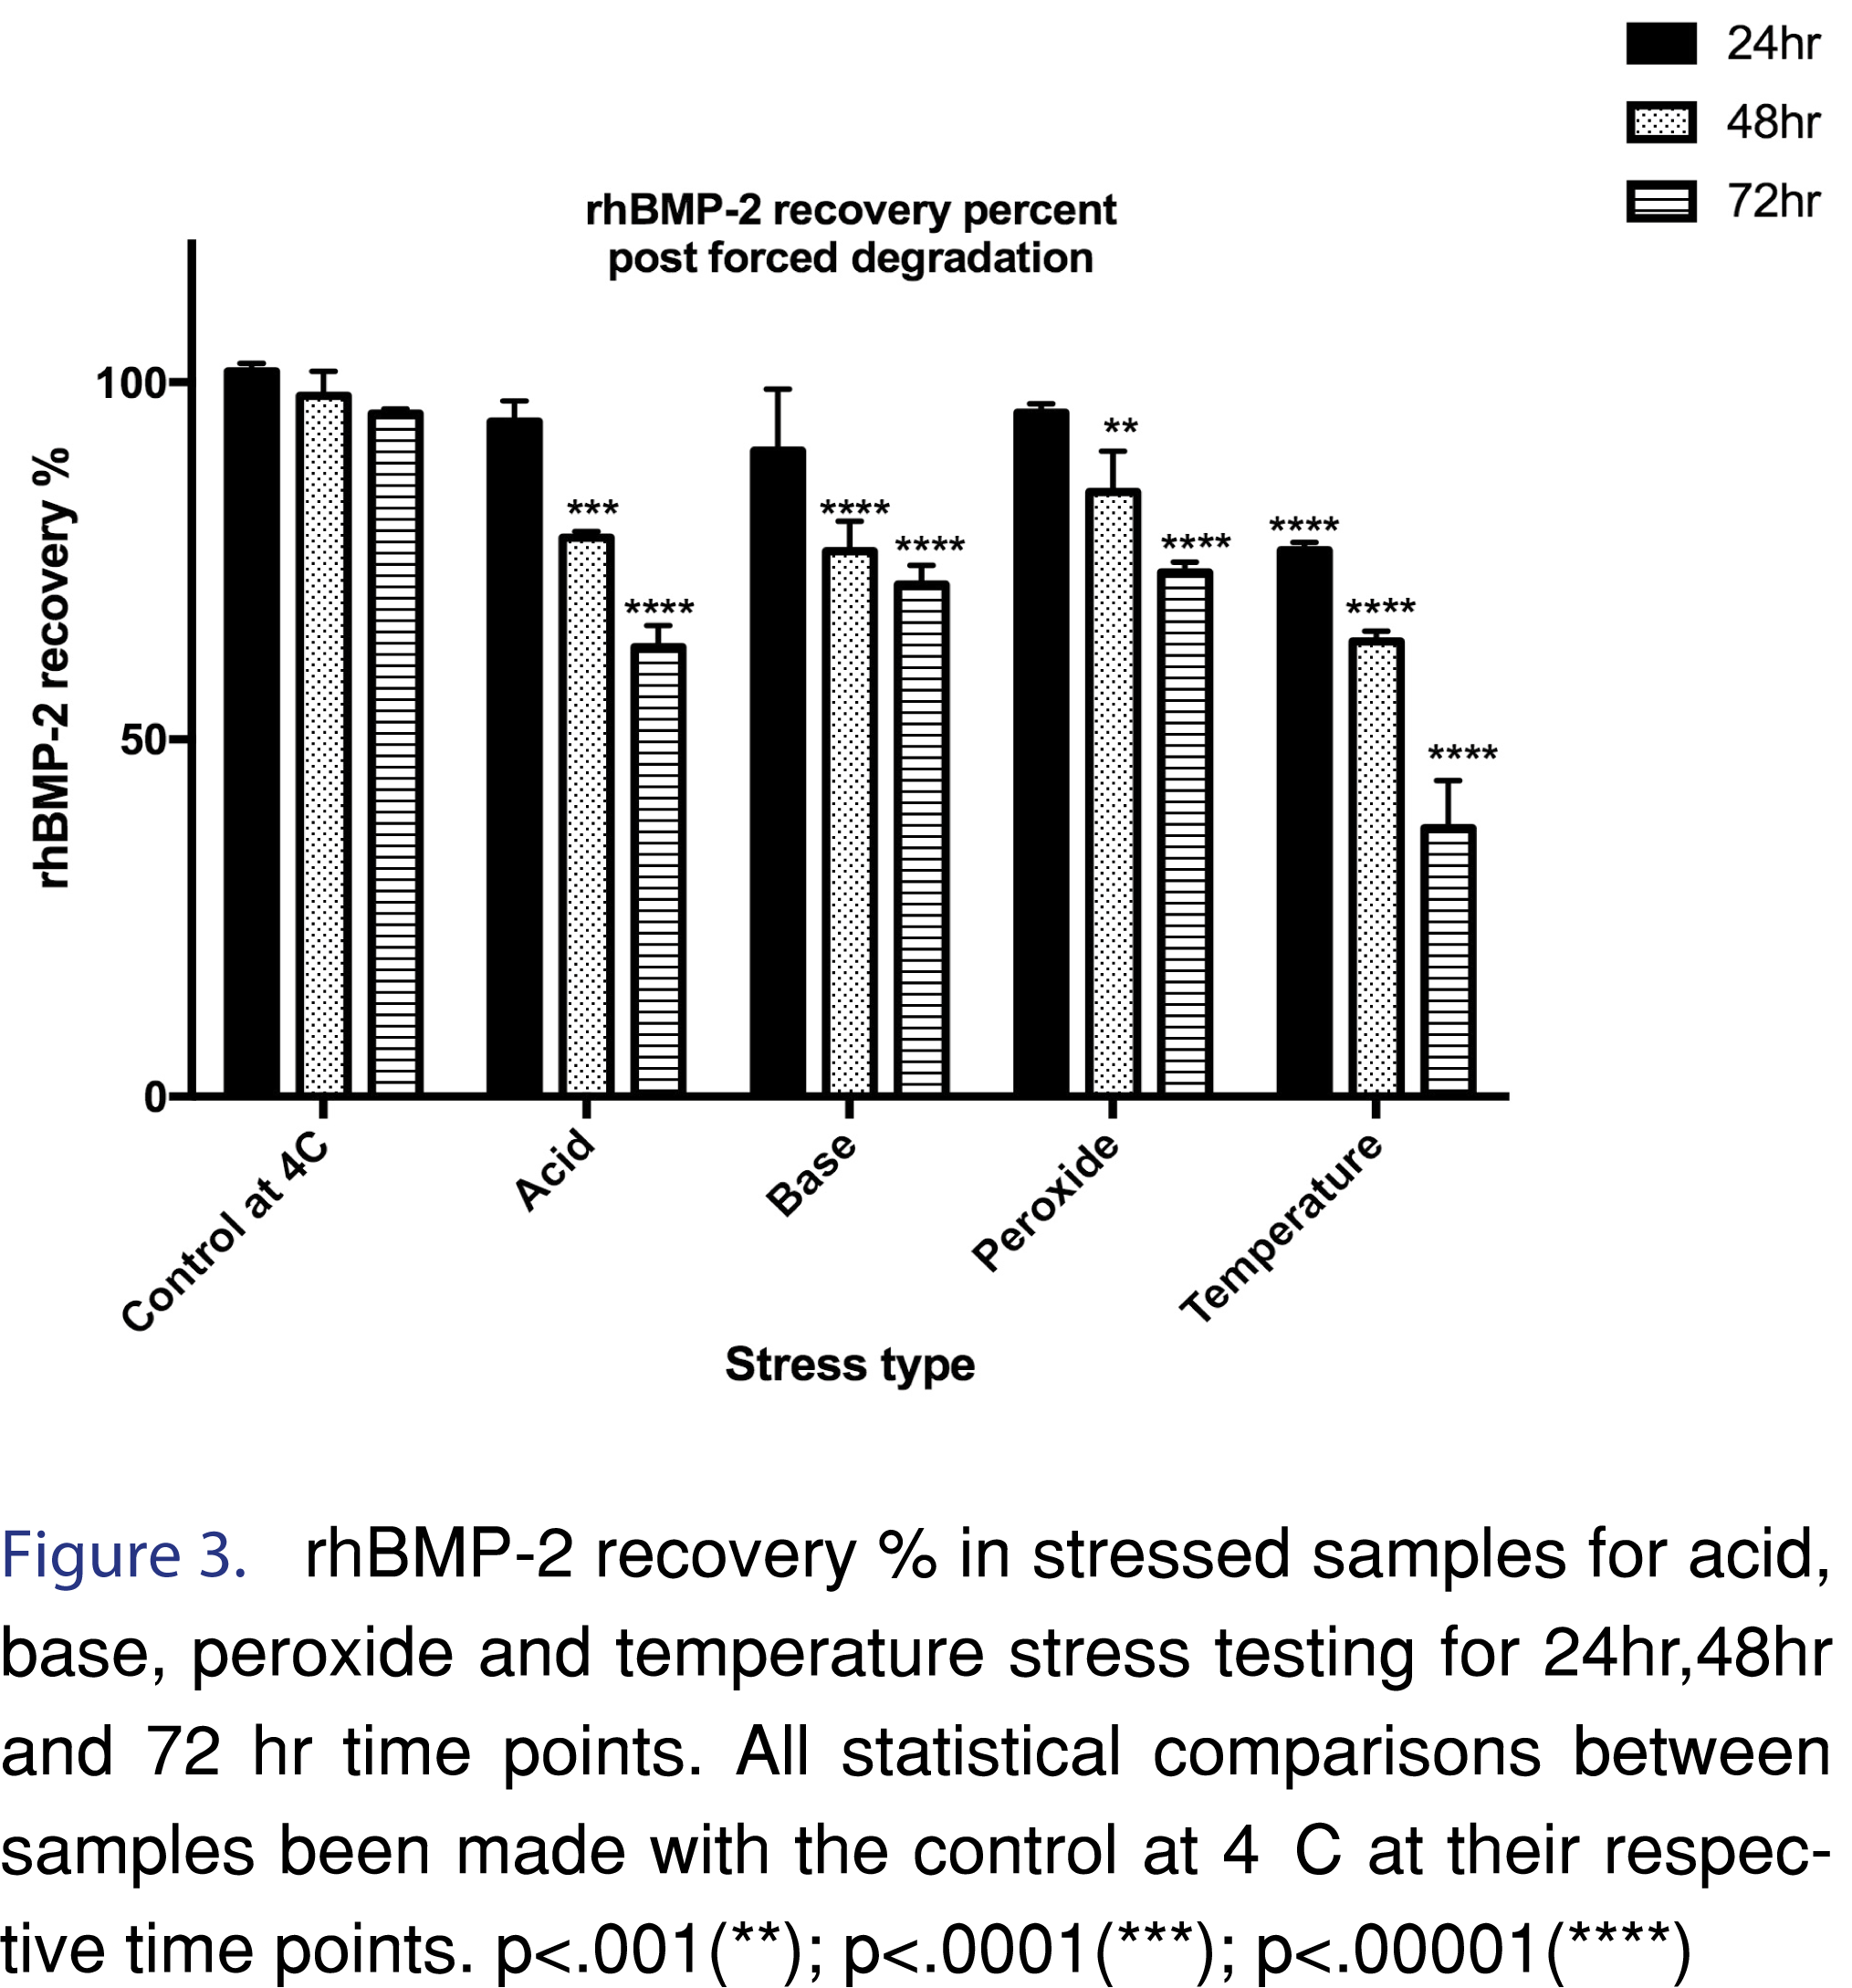
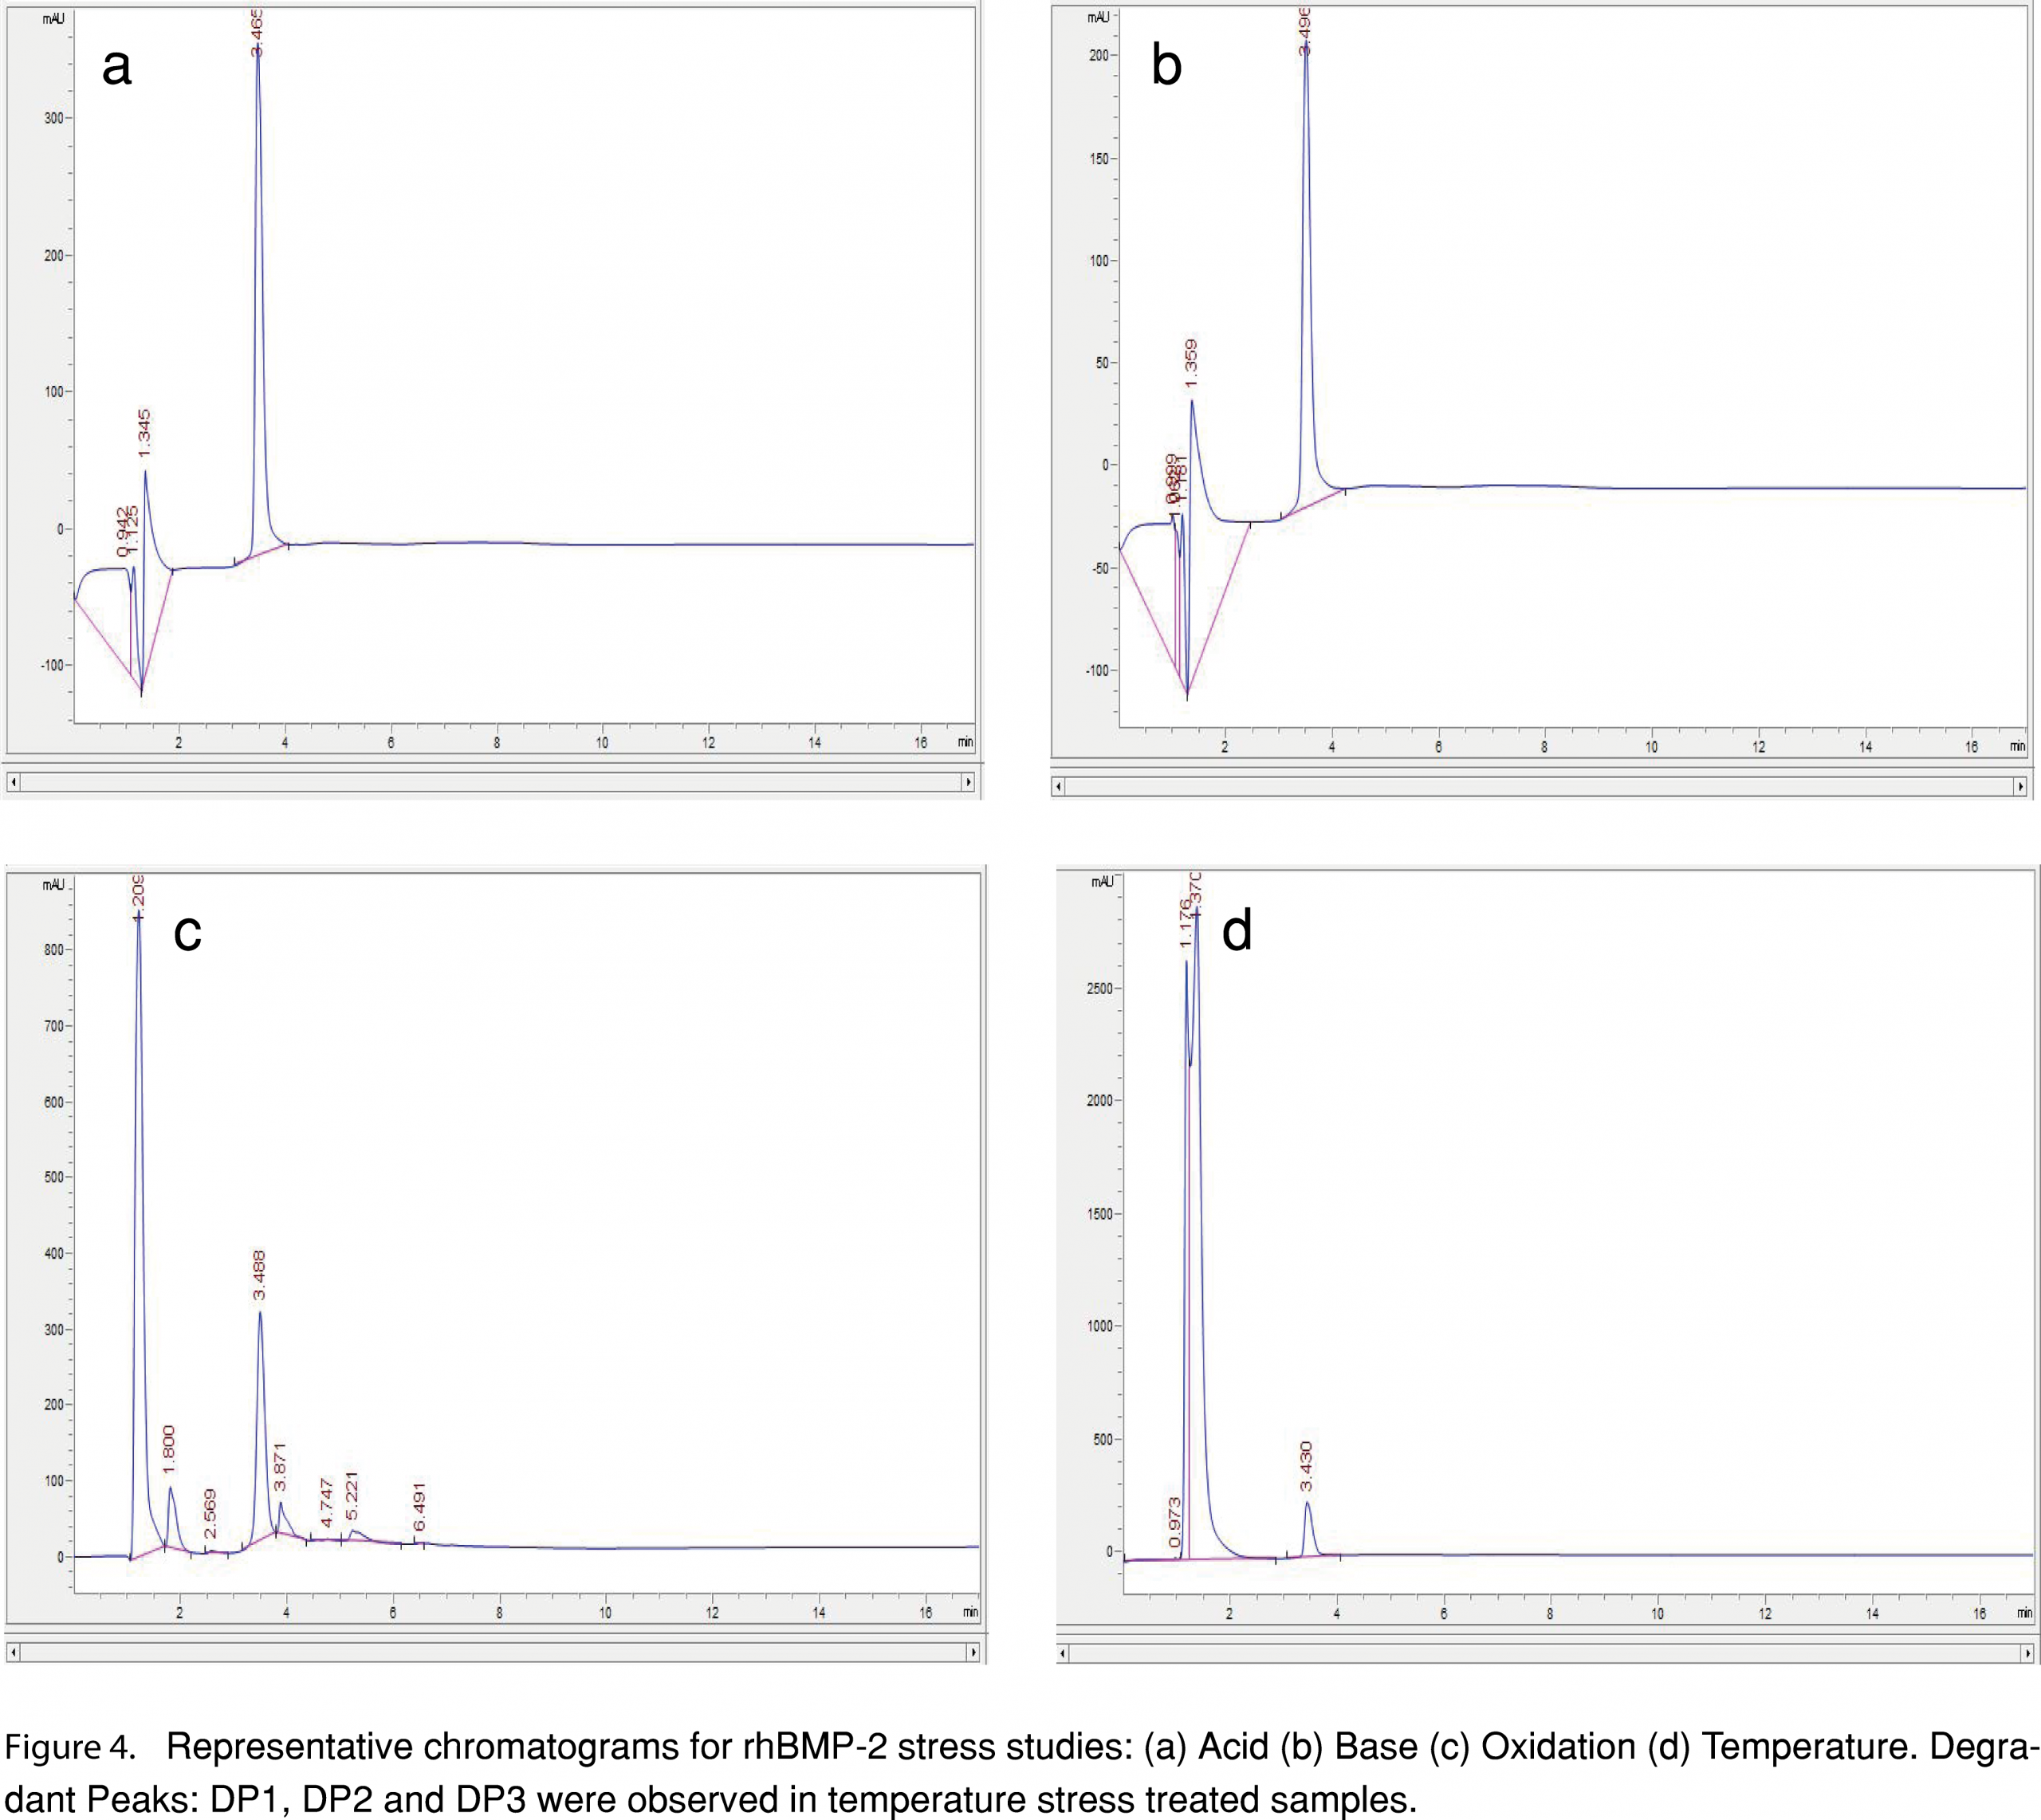
Forced degradation studies in the biorelevant release media helped in the characterization of rhBMP-2 drug remaining after 24 h, 48 h and 72 h under stress testing conditions. Results of the forced degradation studies have been represented in the bar graph in Figure 3. Acid forced degradation showed a recovery percentage of 94.5 ± 2.9 %, 78.3 ± 0.9 % and 62.9 ± 3.0 % after 24 h, 48 h, and 72 h, respectively. Degradation studies in base showed a recovery percentage of 90.4 ± 8.7 %, 76.4 ± 4.2% and 71.7 ± 2.7 % respectively. Oxidative forced degradation yielded a recovery percent of 95.8 ± 1.2 %, 84.7 ± 5.7% and 73.4 ± 1.4 % respectively. Temperature based forced degradation at 70°C showed a much lower level of recovery of rhBMP-2 protein. The recovery percentage of rhBMP-2 at 24 h, 48 h and 72 h were 76.5 ± 1.1%, 63.7 ± 0.4% and 37.6 ± 6.6% respectively. A one-way ANOVA with Dunnett’s multiple comparisons test was performed at a significance level α=0.01. The specific time points (24 h, 48 h, and 72 h) for each of the corresponding stress treated samples were compared with their control at 4°C at the same time point to observe if the means were significantly different. For the 24 h time point, the acid (p=0.1866), base (p= 0.0266) and the peroxide (p= 0.3163) were not significantly different from the control at 4°C but the recovery percentage of rhBMP-2 for temperature was significantly less (p ≤0.0001) than the control. A one-way ANOVA with Dunnett’s multiple-comparisons test at a significance level α=0.01 for 48 h however, showed a greater difference in means when compared to the 48 h control at 4°C. At the 48 h time point all the means were significantly different and decreased than the control: acid (p=0.0002); base (p≤ 0.0001); peroxide (p=.0035) and temperature (p≤0.0001). Similarly, for the 72 h time point, the data showed a further decrease in means as compared to the control sample at 4°C for 72 h. All the stress-tested samples had significantly different and lower means: acid (p ≤0.0001); base (p ≤0.0001); peroxide (p ≤0.0001) and temperature (p≤0.0001). Temperature based stress testing also revealed the presence of three resolved degradation products (DP), which have been labeled as DP1 (retention time= 1.8 min, observed only in the 72 h stress tested sample at 70°C), DP2 (retention time= 3.8 min) and DP3 (retention time= 5.1 min). The representative chromatograms for the stress-tested samples have been shown in Figure 4 (a-d).
3.4. Qualitative mass spectral characterization of glycoforms of BMP-2 and changes observed in stressed samples during forced degradation
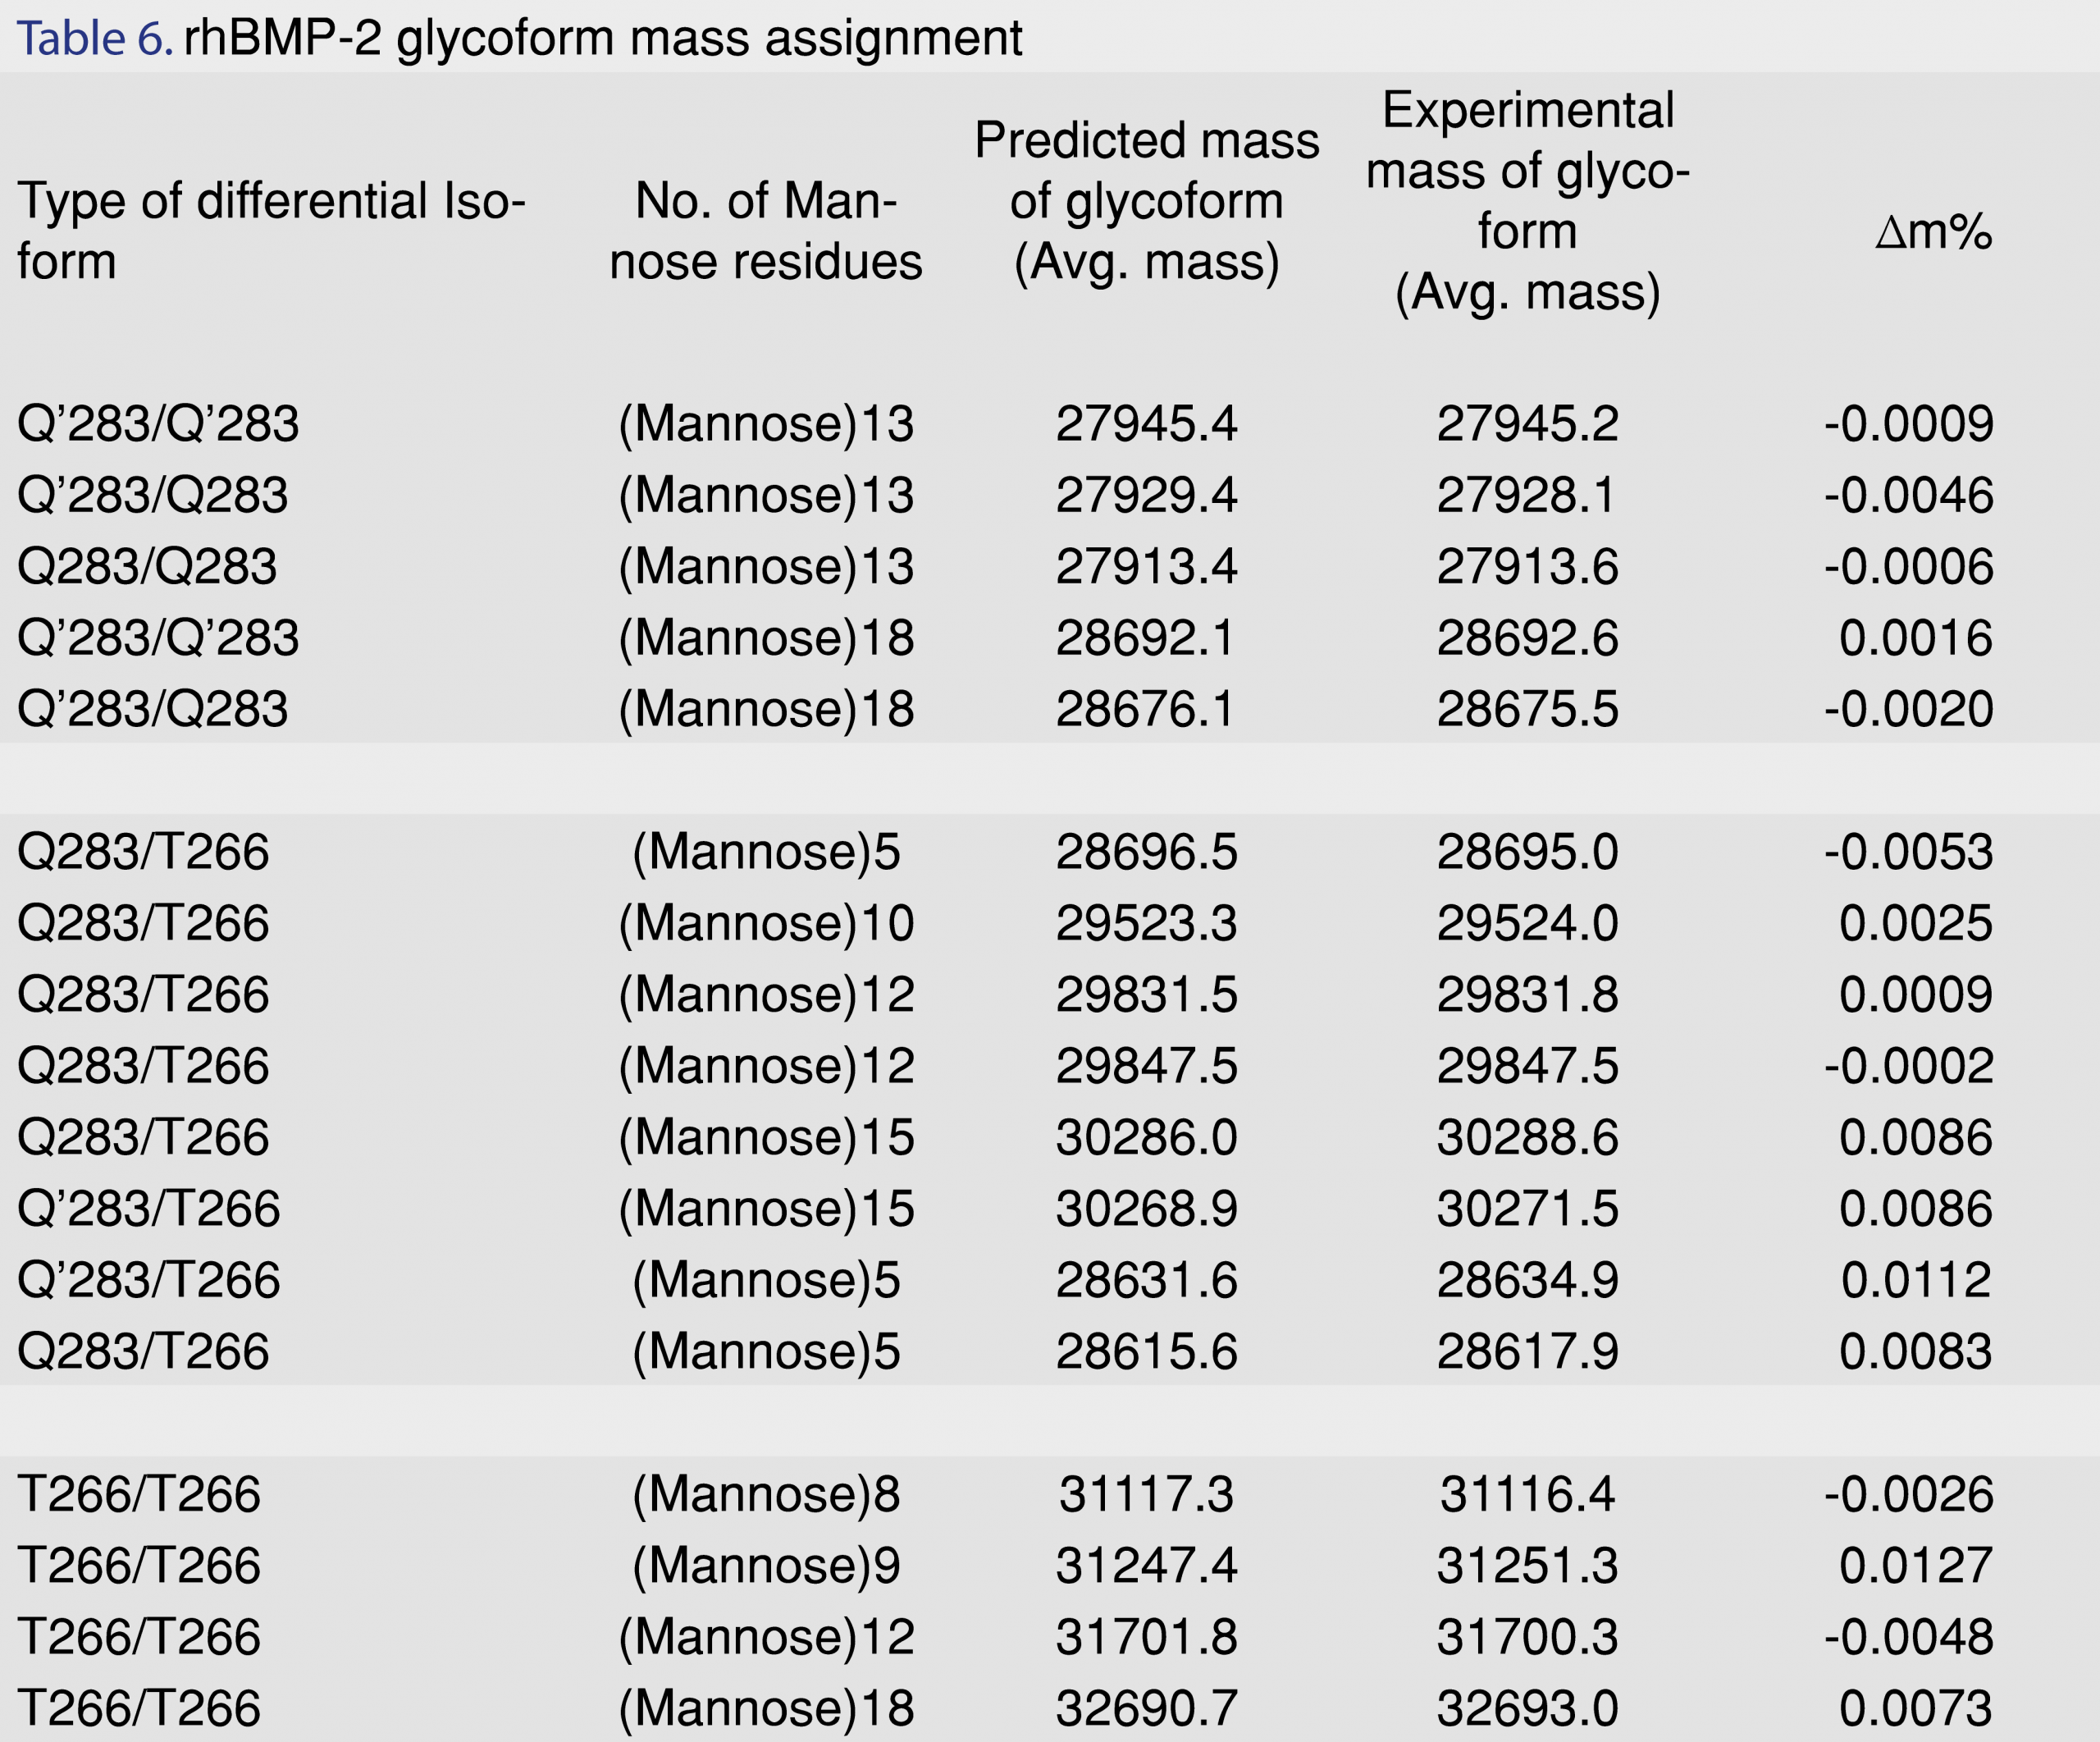
Recombinant human BMP-2 is expressed in Chinese Hamster Ovary (CHO) cell lines as a precursor propeptide. During post-translational processing, heterogeneity in the sequence of amino acids at its N-terminal end leads to a total of six different types of isoforms. Therefore, the rhBMP-2 formulation consists of three distinct N-terminal isoforms: a) Q283/Q283 in which both monomers are processed at the glutamine 283 sites, b) Q283/T266 one monomer processed at the glutamine site and one monomer processed at the threonine site and c) T266/T266 both monomers processed at threonine site [11]. It has also been detected that the glutamine at the N-terminal end converts into pyroglutamate (Q’) in solution form in vitro and in vivo and this leads to a loss of -17.03Da [25]. The glutamate to pyroglutamate conversion results in three additional isoforms: d) Q’283/Q’283 in which both glutamines are converted into pyroglutamate e) Q283/Q’283 in which one glutamine is converted into pyroglutamate f) Q’283/T266 with one pyroglutamate and one threonine [26]. Individually the above isoforms also give rise to a diverse range of glycoforms depending upon the number of mannose residues (generally 5-9), attached to the N-linked glycosylation site. Table 6 is a list of some of the glycoforms with their predicted and experimental molecular weights as observed in the rhBMP-2 non-stress treated control samples.
The effects of stress conditions on rhBMP-2 were explored with peak-trapped samples from an Agilent 1260 HPLC that were subsequently injected onto the LC-MS by direct infusion (at 15 µL/min) into an AB Sciex 4000 Q trap. After deconvolution, a distribution is obtained covering a range of glycoforms from 29 kDa-32 kDa. The temperature-based stress treated sample showed a major decrease in response area in chromatograms and presence of degradation peaks (DP).
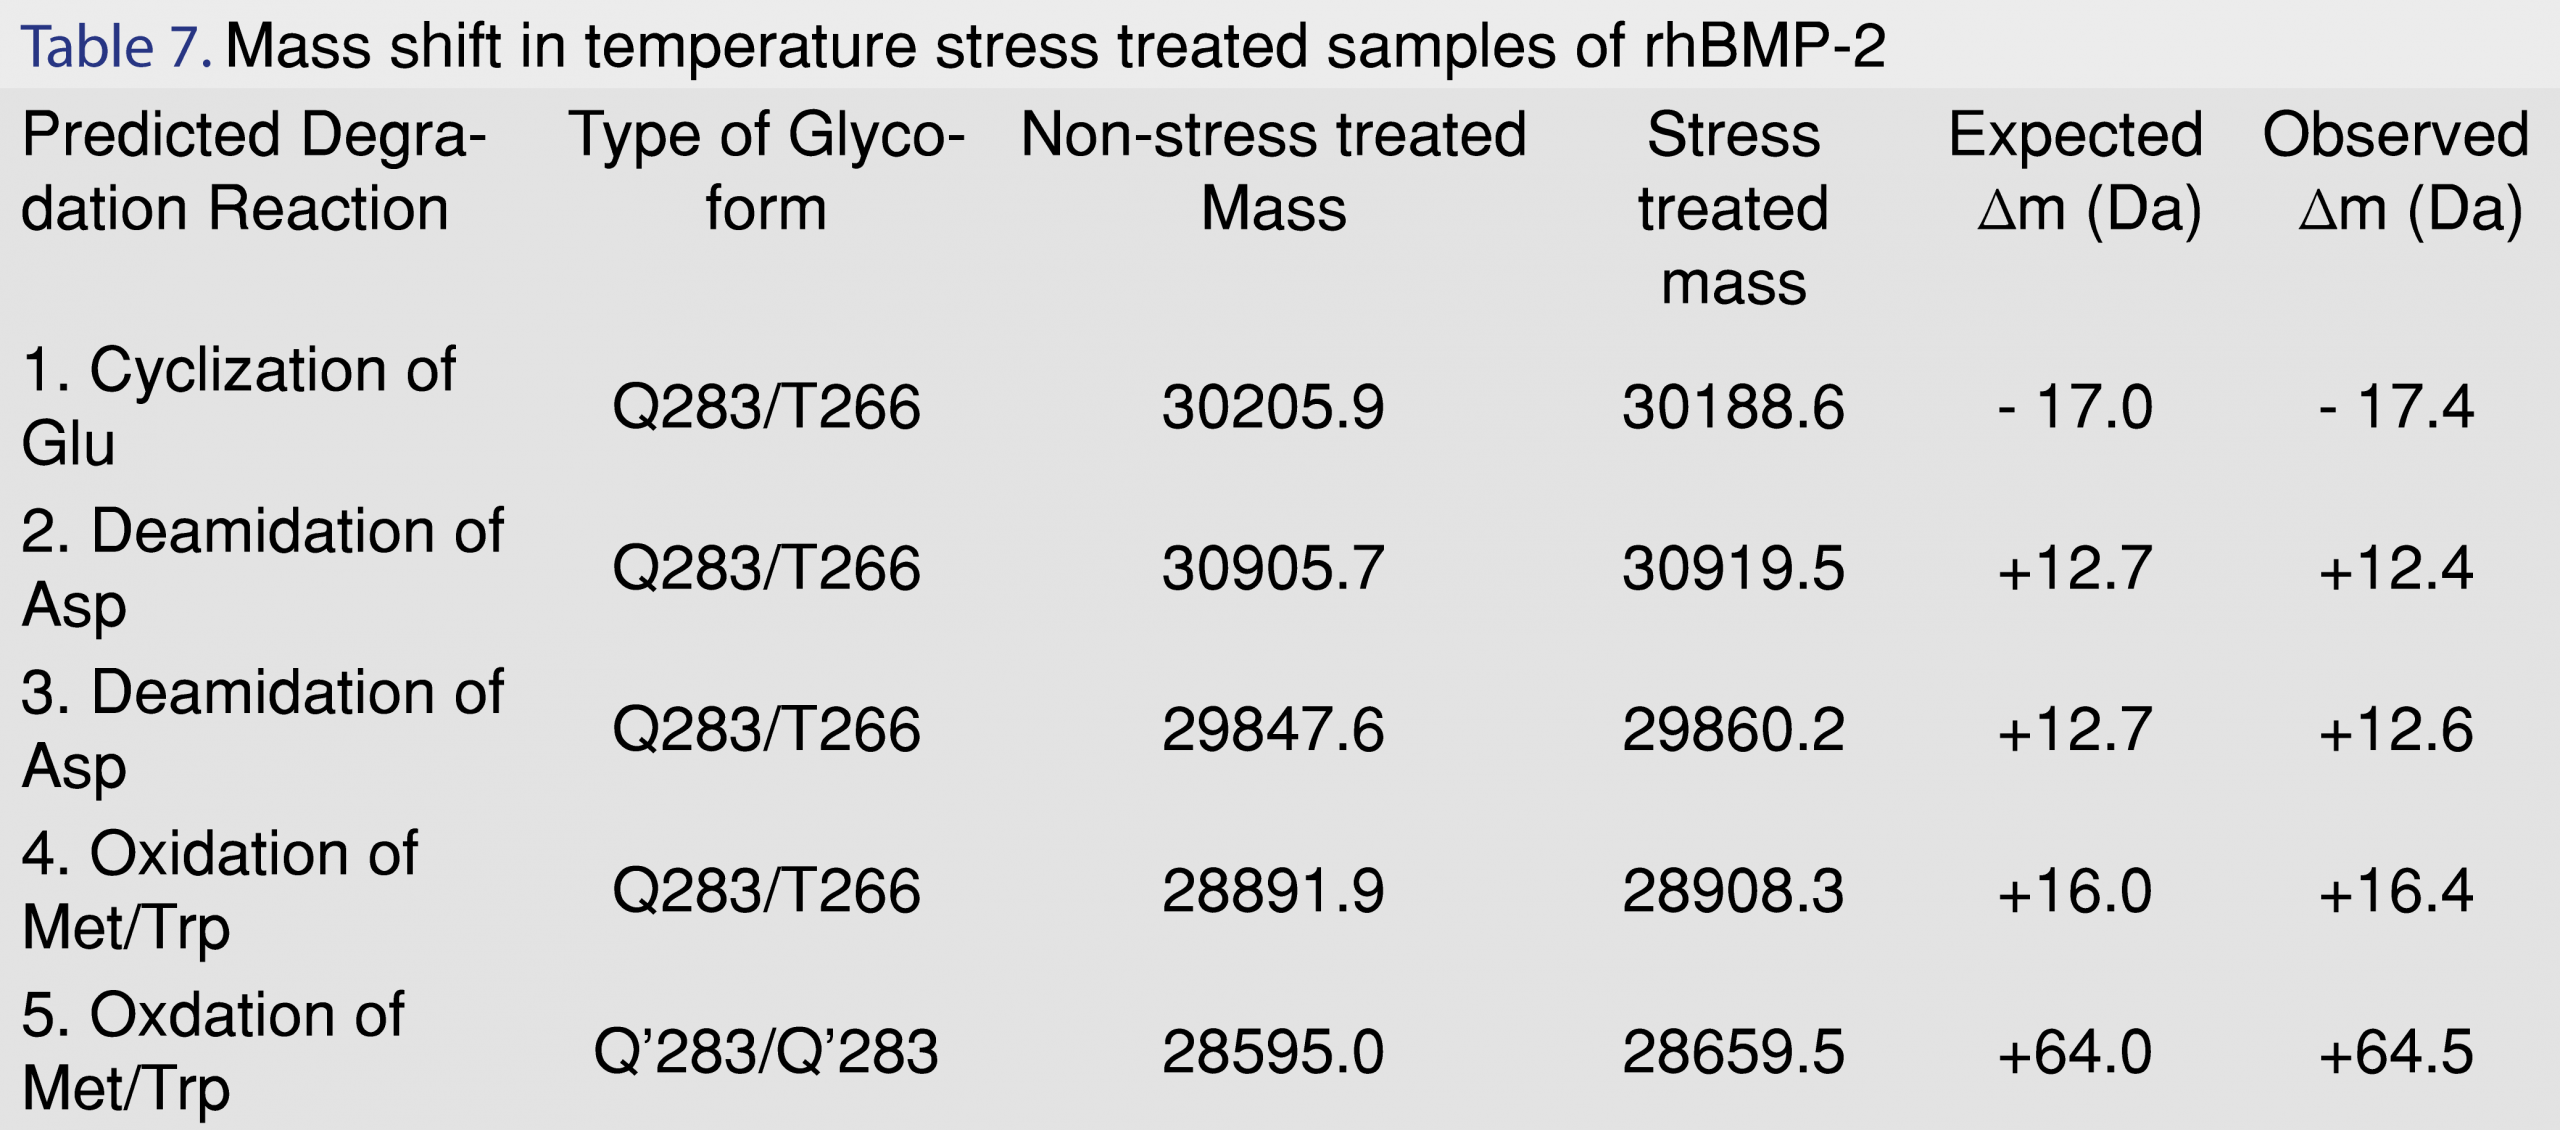
The major degradation pathways for a protein are deamidation, oxidation, hydrolysis and reduction [30]. These reactions frequently cause chemical conversions and degradation in the protein molecule. The chemical changes lead towards inability in maintaining the essential secondary and tertiary conformation of the protein structure. Distortion in folded structure of the protein molecule eventually results in fragmentation, aggregation, and precipitation of the biotherapeutic protein [28,30]. An in-depth survey and comparison of the deconvoluted mass spectra for the control and forced degraded samples revealed the most frequent and repetitive shifts in molecular weight was of +13 Da; +16 Da; +64 Da. The predicted structural changes associated with these observed molecular shifts were as follows: deamidation of asparagine: deamidation of Asp leads to a gain of 0.982 Da due to the conversion of a –NH2 group to an –OH group [31]. rhBMP-2 has 14 asparagine (Asp) residues in its sequence. Asp residues guarded by neighboring hydrophobic and branched chain amino acids exhibit lower rates of deamidation as compared to Asp residues with neutral, polar and hydrophilic amino acids such as glycine and serine [32]. On comparison of the stressed samples to the non-stressed samples, the most frequent observation was a gain of +13 to +14 Da. It was observed that the Q283/T266 glycoform with 10 and 15 mannose residues showed an increase in molecular weight of +12.36 Da (from 30905.73 to 30919.48 Da) and +12.64 Da (from 29847.59 to 29860.22 Da), respectively. Therefore, this deamidation of 13 asparagine residues in rhBMP-2 is most likely due to the high stress temperature of 70°C for 3 days. Similar observations have also been reported in Porter et. al [26] when the protein was subjected to temperature stress at 37°C for 7 days. Further analysis by high resolution/accurate mass MS and NMR will be required to confirm the exact structural changes in the glycoforms for all the stress-treated samples.
Oxidative degradation
Another frequent pathway for degradation of proteins is by oxidative degradation. The amino acids, which are most susceptible to oxidation, are methionine, cysteine, tryptophan and tyrosine [33]. Oxidation generally entails the gain of oxygen and hence, increases in the molecular weight by +16 Da; +32 Da and +64 Da depending upon the number of amino acid residues oxidized. rhBMP-2 dimer shows the presence of 2 tryptophan and two methionine residues on each monomer (hence a total of 4 tryptophan and 4 methionine on each dimer) [34]. An analysis of the molecular weights of the different glycoforms predominantly revealed shifts in molecular weights of +16 or +64 Da (that can be attributed to primarily methionine or tryptophan oxidation) [30]. Predicted oxidative molecular weight increase was mostly observed in Q283/T266 samples an increase in molecular weight of +16.44 Da for a Mannose 7 glycoform (from 28891.850 Da to 28908.286 Da) and a Q’283/Q’283 glycoform of +64.50 Da (from 28585.002 to 28659.512 Da). The various mass shifts have been listed in Table 7. The qualitative characterization information generated from these stress studies will help in future in-depth structural conformation studies using high-resolution MS and NMR.
3.5. Method application to samples of in vitro release study
The developed method was used to quantify release samples from a novel biorelevant in vitro release model with sample concentration well within the calibration curve requiring no dilutions. and for future rhBMP-2 product characterizations. Initial stability degradation studies addressed in section 3.2.4. and Table 4 reveals the stability of the formulation at 37°C in the biorelevant release media. The release was measured in modified Hanks Balanced Salts solution at a pH of 4.5 ± 0.1 and a pH 7.2 ± 0.1 at temperature conditions of 37°C. Approximately 400 samples have been analyzed using the above-validated method. Chromatographic interference from degradation products has not been observed in the samples thereby indicating the robustness of the method.
4.0 Conclusion
A stability indicating method was developed and validated for the first time for quantification of rhBMP-2 protein formulation in release media. The method will help facilitate analysis and quantification of rhBMP-2 protein released from a collagen scaffold-based implant (INFUSE® Bone Graft) for release testing of implants. Future work will include use of tools such as high resolution/accurate mass (HR/AM) MS and NMR for extensive detection and characterization of specific structural and conformation changes that stress induces in the rhBMP-2 glycoprotein. This will be a step towards bridging the gap in higher order structural characterization changes induced by stress in complex biotherapeutic protein formulations and biologics.
5.0 Acknowledgments
The authors wish to thank Medtronic Inc. (Minneapolis, Minnesota) for their donation of rhBMP-2 formulation INFUSE® Bone Graft and Agilent Technologies (Santa Clara, CA) for donating the Zorbax 300-SB, C3 column. The authors also thank the Bioanalytical Shared Resource Laboratory, VCU School of Pharmacy for their instrumentation and supplies.
6.0 References
1. Carragee EJ, Hurwitz EL, Weiner BK. A critical review of recombinant human bone morphogenetic protein-2 trials in spinal surgery: emerging safety concerns and lessons learned. The Spine Journal 11, 471-491 (2011). [CrossRef]
2. Friess W, Uludag H, Foskett S, Biron R, Sargeant C. Characterization of absorbable collagen sponges as rhBMP-2 carriers. Int J Pharm 187, 91-99 (1999). [CrossRef]
3. Urist MR. Bone: formation by autoinduction. Science 150, 893-899 (1965). [CrossRef]
4. Clark DA, Coker R. Transforming growth factor-beta (TGF-beta). Int J Biochem Cell Biol 30, 293-298 (1998). [CrossRef]
5. Geiger M, Li R, Friess W. Collagen sponges for bone regeneration with rhBMP-2. Adv Drug Deliv Rev. 55, 1613-1629 (2003). [CrossRef]
6. McKay WF, Peckham SM, Badura JM. A comprehensive clinical review of recombinant human bone morphogenetic protein-2 (INFUSE® Bone Graft). Int Orthop 31, 729-734 (2007). [CrossRef]
7. Summary of Safety and Effectiveness Data. https://www.accessdata.fda.gov/cdrh_docs/pdf/P000058b.pdf
8. Brown CK, Friedel HD, Barker AR et al. FIP/AAPS joint workshop report: dissolution/in vitro release testing of novel/special dosage forms. AAPS Pharm Sci Tech 12, 782-794 (2011). [CrossRef]
9. Biswas D, Halquist M. Using Biorelevant in Vitro Models Testing to Characterize Release of Non Oral Dosage Forms as another Tool for Safety. J Pharmacovigil 4, e153, (2016). [CrossRef]
10. Lyer SS, Barr WH, Karnes HT. Characterization of a potential medium for ‘biorelevant’ in vitro release testing of a naltrexone implant, employing a validated stability-indicating HPLC method. J Pharm Biomed Anal 43, 845-853 (2007). [CrossRef]
11. Israel DI, Nove J, Kerns KM, Moutsatsos IK, Kaufman RJ. Expression and Characterization of Bone Morphogenetic Protein-2 in Chinese Hamster Ovary Cells. Growth Factors 7, 139-150 (1992). [CrossRef]
12. Chen D, Harris M, Rossini G et al. Bone morphogenetic protein 2 (BMP-2) enhances BMP-3, BMP-4, and bone cell differentiation marker gene expression during the induction of mineralized bone matrix formation in culturesof fetal rat calvarial osteoblasts. Calcif Tissue Int 60, 283-290 (1997). [CrossRef]
13. Hanks JH. The longevity of chick tissue cultures without renewal of medium. J Cell Comp Physiol 31, 235-260 (1948). [CrossRef]
14. Luca L, Capelle MA, Machaidze G, Arvinte T, Jordan O, Gurny R. Physical instability, aggregation and conformational changes of recombinant human bone morphogenetic protein-2 (rhBMP-2). Int J Pharm 391, 48-54 (2010). [CrossRef]
15. Consortium U. UniProt: a hub for protein information. Nucleic Acids Res gku989, (2014).
16. Walker JM. The proteomics protocols handbook, Springer (2005). [CrossRef]
17. Hollinger J, Wong ME. The integrated processes of hard tissue regeneration with special emphasis on fracture healing. Oral Surg. Oral Med. Oral Pathol. Oral Radiol 82, 594-606 (1996). [CrossRef]
18. Silver I, Murrills R, Etherington D. Microelectrode studies on the acid microenvironment beneath adherent macrophages and osteoclasts. Exp Cell Res 175, 266-276 (1988). [CrossRef]
19. U.G. Chapter, in: USP35-NF30, The United States Pharmacopeia Convention, official December, (2012). https://www.uspnf.com/
20. Guidance for industry: bioanalytical method validation. US Department of Health and Human Services, Food and Drug Administration, Center for Drug Evaluation and Research (CDER), Center for Veterinary Medicine (CV), (2018). https://www.fda.gov/downloads/drugs/guidances/ucm070707.pdf
21. Geenen S, Guallar-Hoyas C, MichopoµLos F et al. HPLC–MS/MS methods for the quantitative analysis of 5-oxoproline (pyroglutamate) in rat plasma and hepatic cell line culture medium. J Pharm Biomed Anal 56, 655-663 (2011). [CrossRef]
22. Hermeling S, Crommelin DJ, Schellekens H, Jiskoot W. Structure-Immunogenicity Relationships of Therapeutic Proteins. Pharm Res 21, 897-903 (2004). [CrossRef]
23. Li RH, Wozney JM. Delivering on the promise of bone morphogenetic proteins. Trends Biotechnol 19, 255-265 (2001). [CrossRef]
24. Kim JY, Kim YG, Lee GM. CHO cells in biotechnology for production of recombinant proteins: current state and further potential. Appl Microbiol Biotechnol 93, 917-930 (2012). [CrossRef]
25. Reimer J, Shamshurin D, Harder M, Yamchuk A, Spicer V, Krokhin OV. Effect of cyclization of N-terminal glutamine and carbamidomethyl-cysteine (residues) on the chromatographic behavior of peptides in reversed-phase chromatography. J Chromatogr A 1218, 5101-5107 (2011). [CrossRef]
26. Porter TJ, Rathore S, Rouse J, Denton M. Biomolecules in tissue engineered medical products (TEMPs): A case study of recombinant human bone morphogenetic protein-2 (rhBMP-2). J ASTM Int 1, 1-21 (2004). [CrossRef]
27. Cooper CA, Gasteiger E, Packer NH. Predicting glycan composition from experimental mass using GlycoMod, in: Handbook of Proteomic Methods, Springer, 225-231 (2003). [CrossRef]
28. Bhatnagar BS, Bogner RH, Pikal MJ. Protein stability during freezing: separation of stresses and mechanisms of protein stabilization. Pharm Dev Technol 12, 505-523 (2007). [CrossRef]
29. Pikal-Cleland KA, Rodríguez-Hornedo N, Amidon GL, Carpenter JF. Protein denaturation during freezing and thawing in phosphate buffer systems: monomeric and tetrameric β-galactosidase. Arch Biochem Biophys 384, 398-406 (2000). [CrossRef]
30. Patel J, Kothari R, Tunga R, Ritter NM. B.S.T. Stability Considerations for Biopharmaceuticals: Overview of Protein and Peptide Degradation Pathways. Bioprocess Int (2011).
31. Yang H, Zubarev RA. Mass spectrometric analysis of asparagine deamidation and aspartate isomerization in polypeptides. Electrophoresis 31, 1764-1772 (2010). [CrossRef]
32. Tyler-Cross R, Schirch V. Effects of amino acid sequence, buffers, and ionic strength on the rate and mechanism of deamidation of asparagine residues in small peptides. J Biol Chem 266, 22549-22556 (1991).
33. Li S, Schöneich C, Borchardt RT. Chemical instability of protein pharmaceuticals: mechanisms of oxidation and strategies for stabilization. Biotechnol Bioeng 48, 490-500 (1995). [CrossRef]
34. Ji JA, Zhang B, Cheng W, Wang YJ. Methionine, tryptophan, and histidine oxidation in a model protein, PTH: mechanisms and stabilization. J Pharm Sci 98, 4485-4500 (2009). [CrossRef]
All site content, except where otherwise noted, is licensed under a Creative Commons Attribution 4.0 License