OPEN-ACCESS PEER-REVIEWED
RESEARCH ARTICLE
Gyorgy Vas
VasAnalytical, Flemington, NJ 08822, USA.
Reviews in Separation Sciences. Vol.3. No.1. pages e21004 (2021).
Published on-line 25 October 2021. https://doi.org/10.17145/rss.21.004 | (ISSN 2589-1677).
*Correspondence:
Vas G. . VasAnalytical, Flemington, NJ 08822, USA.
Editor: Victoria Samanidou, Aristotle University Thessaloniki, Thessaloniki, Greece.
Open-access and Copyright:
©2021 Vas G. This article is an open-access article distributed under the terms of the Creative Commons Attribution License (CC-BY) which permits any use, distribution, and reproduction in any medium, provided the original author(s) and source are credited.
Funding/Manuscript writing assistance:
The author declared that no funding and writing assistance was utilized in the production of this article.
Competing interest:
The author has declared that no competing interests exist.
Article history:
Received 02 June 2021, Revised 19 August 2021, Accepted 14 September 2021.
Abstract
The current national outbreak of electronic-cigarette, or vaping, product use–associated lung injury (EVALI) have been reported and started to be investigated by CDC, so far without a conclusive outcome of the root cause. The root of the problem may be associated with multiple factors, including thermal degradation of Vitamin E acetate (VEA), which could produce degradation products with potential risk to human health.
This study is focused on generating and identifying the volatile thermal degradation products of VEA using GC-High-Resolution-MS (GC-HRAMS) system. The degradation was studied in a range of 50-280°C, which is aligned to the highest temperature settings of some of the marketed products. More than 40 volatile degradation products were found and a majority of them were identified. The study demonstrates that below a certain temperature the formation of degradation products is negligible therefore the associated health risk may be low.
Keywords
EVALI, HRAM GC-MS, HS-SPME, vaping, vitamin E acetate degradation.
1.0. Introduction
“Vaping” (i.e., heating) is the practice of inhaling an aerosol created by heating a liquid or wax containing substances, such as nicotine, cannabinoids (tetrahydrocannabinol; Δ9-THC), or cannabidiol. The “active” ingredients are formulated with different excipients, additives, and flavorings such as propylene glycol, glycerol, Vitamin E acetate. There are many available devices to generate an aerosol, including electronic cigarettes, e-cigarettes, vape pens, or vape mods.
Vitamin E acetate is an oily chemical commonly added to THC vaping liquids to dilute or thicken them. The substance has been acknowledged as a potential toxin of concern by the Centers for Disease Control and Prevention (CDC) due to its ability to remain in the lungs for long periods of time and therefore cause complications in the lungs [1]. The identification of VEA as a harmful chemical in vaping liquid allows physicians to implement more concentrated care when treating vape-related illnesses and allows for the general public to gain a better understanding of the harmful substances in vaping products. Through recent research, a combined analytical, theoretical, and experimental study has shown that the vaping of VEA has the potential to produce toxic ketene gas, which may be a contributing factor to the upsurge in lung injuries associated with vaping products [2].
Vitamin E acetate (VEA) is a chemical variant of Vitamin E (acid esters of tocopherol naturally occur in lower abundance than vitamin E [3]) and is often used in topical products such as skin creams or medications. Vitamin E acetate is a fat-soluble liquid when kept at room temperature and therefore, has been used as a thickening agent for some THC vape cartridge manufacturers [4], and in THC vape cartridges have been linked to vaping-related lung disease, also referred to as EVALI [5].
While VEA typically does not cause harm when ingested, research suggests that when it is inhaled, it may interfere with normal lung functioning, as when vaporized could form toxic species [1,2,5]. Electronic cigarettes were first developed in China in the early 2000s and introduced to the US market in 2006 [6,7]. In the US, the product experienced explosive growth, with the number of electronic cigarette users doubling every year between 2008 and 2012. Since the introduction of e-cigarette, global use has grown almost exponentially. For instance, in the UK, the number of users has increased from 700,000 in 2012 to 3.6 million in 2019 and showed a slight decrease to 3.2 million in 2020 (Action on Smoking and Health 2020 report [8]). The general perception about e-cigarettes is that they represent a safer and healthier approach to smoke-based products, therefore e-cigarette has become a rising trend, particularly among youth. Some market estimates suggested that global sales have reached US $3.5 billion in 2015, which was a 170-fold increase compared to 2008. e-cigarettes were preliminarily used as an alternative for smoking. Today, however, e-cigarettes are gaining popularity and becoming widely used by students and non-smokers.
There is the claim that e-cigarettes can help people to quit smoking. Yet, many vapers also smoke traditional cigarettes, leading to the concern that such dual-use is delaying or deterring smoking cessation. According to World Health Organization, there is no sufficient evidence to prove that e-cigarettes help smokers quit the habit and its safety remains unknown. Thus, e-cigarettes have not yet been recognized as a legitimate tool for smoking cessation [9].
Several research studies (both in EU and US) have identified toxic chemicals and carcinogenic substances in e-cigarettes, such as nicotine, various additives, heavy metals, propylene glycol, glycerin, formaldehyde, and acetaldehyde [10,11]. Most of these substances have been shown to cause various health problems, such as nausea, bradycardia, respiratory depression, and lung diseases. Other unknown ingredients and substances released during the vaping process may also cause negative effects on the health of users and other people. Unintended exposure of e-liquid to children could cause vomiting, coughing, choking, and death [9]. Electronic cigarettes (e-cigarettes), unlike conventional cigarettes, do not burn tobacco to deliver the active (nicotine or THC) [12] and the flavor(s) (menthol is FDA approved flavor for conventional smoke-tobacco, however in April of 2021 FDA announced to ban the menthol flavoring [13], while no such flavor officially approved for e-products). In the past decade, a number of alternative vaping products have rapidly gained consumer demand, especially in adolescents due to the belief that they are much safer (lower nicotine content) than traditional cigarettes [14] and the increased choice offered by advertisements of different flavors and ease of access to electronic nicotine delivery systems (such as e-cigarettes and vape pens) [15,16]. Except for menthol, the use of flavor additives has been banned from traditional cigarettes, whereas e-cigarettes are marketed in over 7,000 different flavors [17]. Many of those flavors are found in candy and popular soft drinks and, because adolescents are familiar with such flavors, e-cigarettes are appealing to them. While traditional cigarettes are smoked through combustion, e-cigarettes are “vaped,” and the resultant aerosols potentially contain a reduced number of potentially toxic chemicals [14], such as nicotine and flavorings like diacetyl and cinnamaldehyde [18], as well as byproducts like formaldehyde and acrolein caused by the potential overheating of propylene glycol, and glycerin. While there are decades of characterization studies and numerous standardized analytical procedures for conventional cigarettes, relatively little published analytical data exists for commercial e-cigarette products. Furthermore, no standardized test methods or reference products exist for e-cigarettes [19,20].
The generally accepted early concept (which is being “fine-tuned” those days [16]), those electronic cigarettes are considered to provide a safe alternative and reduce chemical exposure to conventional cigarettes because they deliver flavors and nicotine through a heat mediated vaporization rather than by burning the constituents, however, the vaporization process generates different chemicals [10,21]. Limited data is available for the volume of exposure and the overall safety of those chemicals, as they are directly inhaled after the vaporization [22]. There is also little known about how the evaporated glycerin or glycol impacts the absorption of the chemicals delivered through the vaping process.
Although vaping has become an integral part of the adolescent culture in recent years, the medical effects of vaping have only recently been brought to light. Many adolescents have experienced lung illnesses related to vaping and there have been a number of people that have died due to complications from vaping-related illnesses [5].
The possible causes for these complications are still widely debated, as many believe these illnesses could be caused by a multitude of ingredients found in vape. In a case study of hard-metal pneumoconiosis published in the European Respiratory Journal, researchers tested the patient’s cannabis-based e-cigarette and found cobalt in the released vapor as well as other toxic metals such as nickel, aluminum, manganese, lead, and chromium [23]. Metal-induced toxicity in the lung can result in long-term if not, permanent damage. The ingredients of vape that are suspected of contributing to the development of vaping-related illnesses are THC, VEA, and some of the flavoring ingredients [2,18].
Vaping product use associated lung injury (EVALI, also called vaping associated pulmonary injury [VAPI]) is an acute or subacute respiratory illness with damage to the alveoli that can be severe and life-threatening [24,25]. There are many available devices to generate this aerosol, including battery-operated electronic cigarettes, e-cigarettes, vape pens, or vape mods [26]. While the specific cause of vaping-related illnesses has been widely debated among the general public and physicians, new research points to vitamin E acetate as a potential culprit in the vape-related lung illness outbreak [17]. While it is still widely debated which particular component of vape liquid is the cause of illness, vitamin E acetate, specifically, has been identified as a potential culprit in vape-related illnesses [17,27].
A recently published paper in the Proceedings of the National Academy of Sciences of the United States of America by Wu and O’Shea confirms the possibility of the formation of toxic ketene moieties from Vitamin E acetate during the high-temperature evaporation process [2] and those ketene species are being reported as causing sensitization or even death in animal studies when it was inhaled [28]. As the ketene species show very high reactivity, they can modify the structure of proteins and it is assumed they have similar action of mechanism as that for phosgene. However, it is an analytically challenging task to confirm the presence of highly reactive ketene species in forced degradation experiments as they react quickly [21]. Another report for the potential toxicity of VEA was published by FDA researchers in connection with forming hydrogen bonding between VEA and Δ9-THC. This comprehensive paper mainly focuses on the detection and confirmation of VEA and THC chemical complexes, using various analytical techniques, including FT-IR, NMR, and DART-HRMS [5].
It is a well-known fact from chemistry textbooks that at higher temperatures the speed of the chemical reaction is enhanced [29], therefore it is expected to see a higher level of degradation products at a higher temperature. The “vaping temperature” for electronic delivery devices is controlled through a heating coil but there is no “standardized” temperature being established across the e-cigarette industry [11]. It is clear that the vaping temperature is below the combustion temperature and it is in a temperature region of evaporation/pyrolysis depending on the performance of the vaporizer element [30]. Different marketed products are generating “vape” at different temperatures, and thus devices can be differentiated based on the “vaping” temperature (low, medium, or high-temperature devices) [31,32].
The purpose of this study is to find and confirm Vitamin E acetate-related volatile thermal degradation products and attempt to propose structures for the different volatile species. The study has no intention or claims to address the toxicity of the identified species, however, based on our findings it could support further evaluation by an expert toxicologist to address the potential impact on human health.
2.0 Experimental
2.1. Chemicals and Standards
Tocopheryl acetate is commonly known as Vitamin E acetate ([(2R)-2,5,7,8-Tetramethyl-2-[(4R,8R)-4,8,12-trimethyltridecyl]chroman-6-yl] acetate, CAS 58-95-7), and IS/RS of 2-flourobiphenyl (2-FBP) among with the dichloro-methane was purchased from Sigma Aldrich (St. Louis MO. USA).
2.2. Sample Preparation Methods
2.2.1. Preaparation of Standard Solutions
Stock solutions of VEA and the IS/RS analyte were prepared in DCM as an individual solution at a concentration of 5 mg/mL level. Liquid samples of VEA standard were transferred to an ultraclean glass vial, using a calibrated positive displacement automatic pipette, and weighted in an analytical microbalance. The microbalance was calibrated according to USP <41> [33], and the minimum weight was determined as 10 mg, the calibration checked on a daily basis. Working standard solutions of the IS/RS were prepared by dilution of the stock to 10 µg/mL (parts per million) concentration. The serial dilution of the stock was performed by transferring the liquids with calibrated automatic pipettors. The stock solution of the Vitamin E acetate was used as is and the IS/RS working standard was used for spiking the thermal degradation samples
2.2.2. Preparation of Samples for Thermal Degradation Experiments
Samples for thermal degradation were prepared in a 20 mL ultra-high purity screw cap HS vial. One hundred micrograms (0.1 mg) of VEA was placed into the HS vial by transferring one 20 microliter portion and the vial was kept open for 4 hours until the DCM was completely evaporated. After the solvent was completely evaporated (no presence of DCM in the head-space), the vials were spiked with 100 ng of IS/RS using 10 microliters of the working standard solution. After the IS/RS spike, the vials were flushed for 20 seconds with high purity nitrogen to prevent unnecessary oxidation and closed with PTFE-faced silicone septa. Each and every vial prepared in that manner contains 100 µg of VEA and 100 ng of IS/RS.
2.2.3. Preparation of Samples for Thermal Degradation Experimentss
Sample vials with the IS/RS and the VEA were placed in an aluminum block heater and placed into a GC oven. One set of vials were kept at room temperature were used as a control sample to evaluate the baseline levels of the volatiles. The GC oven was programmed from 50-280°C with 10°C steps and the temperature was kept for 10 minutes at each step. Samples were replaced after the end of each temperature step. Two samples were prepared at each temperature step. After the samples were removed from the GC oven they were cooled down and placed in the HS autosampler rack of the GC-HRAMS system.
2.2.4. SPME Extraction of the Thermal Degradation Samples
The thermal degradation samples were extracted with HS-SPME. Samples were incubated at 85°C for 10 minutes and extracted with a 100 µm PDMS extraction fiber. The extracted analytes were thermally desorbed from the PDMS fiber in a hot PTV injector at 260°C using splitless injection mode. (Note that SPME injection is not influenced by solvent evaporation vs. injecting liquid to the system [34,35]).
2.4.5. GC-MS method
Thermo Scientific GC-Orbitrap® High-Resolution Accurate Mass System (referenced as GC-Orbi) was used for the testing [36,37]. It is equipped with a PTV injection system [38], which was used in hot constant temperature splitless mode at 260°C with a 3 minute splitless time. For the chromatographic separation, a Restek Rxi 5 MS 30 m x 0.25 mm with 0.25 µm film thickness (β=250) with He carrier (Ultra High Purity, less than 1 ppm total impurities) at 1.2 mL/min constant flow was used. The temperature program was starting at 50°C (1-minute hold) to 300°C at 20°C/min (10-minute hold). Electron ionization at 70 eV energy with 50 µA current with an ExtractaBrite™ ion source operated at 275°C. The high-resolution system was calibrated on a daily basis and the mass error for the calibration peaks was below 0.5 ppm. The overall mass error for the observed degradation species is presented in Tables 1 and Table 2.
Figures and Tables
[Click to enlarge]
3.0 Results and Discussion
The degradation samples were evaluated based on high-resolution accurate mass-based scan data, which means multiple high-resolution scans (8 full scans per second) were collected across each chromatographic peak to support the identification of the formed degradation species. This form of data acquisition allows the user to perform multiple levels of data processing once the data is acquired. The 1st round of the evaluation (presented in this paper) was based on a TTC (threshold of toxicological concern) level of 540 µg/day exposure level (Cramer class II) [39,40]. The rationale was chosen based on the fact that vitamin E acetate is generally approved as safe (GRAS) for oral route of administration [41] and can be used safely as a food supplement and as well for cosmetics [42]. Understanding that for inhalation route of exposure the toxicity may be different it needs to be further evaluated and addressed. (The toxicological risk assessment is outside the scope of this paper.) The calculation of the exposure levels was based on the assumption that approximately 4 mL of the e-liquid consumed daily [43] and an estimate of 50% VEA was used as a diluent, resulting in a 2 mL exposure to the lung tissue. This calculation may represent a conservative over-exposure approach.
The level of detected chromatographic peaks was evaluated based on the response of the spiked IS/RS peaks that are above the 540 µg/day exposure level identified based on their mass spectra. Identification was supported by NIST EI spectral database, the elemental composition of the molecular ion, and the different fragment ions [2,44,45]. Structure assignments were attempted based on the collected high-resolution mass spectral data and fragmentation was supported by the elemental composition of the fragments and the molecular ion(s).
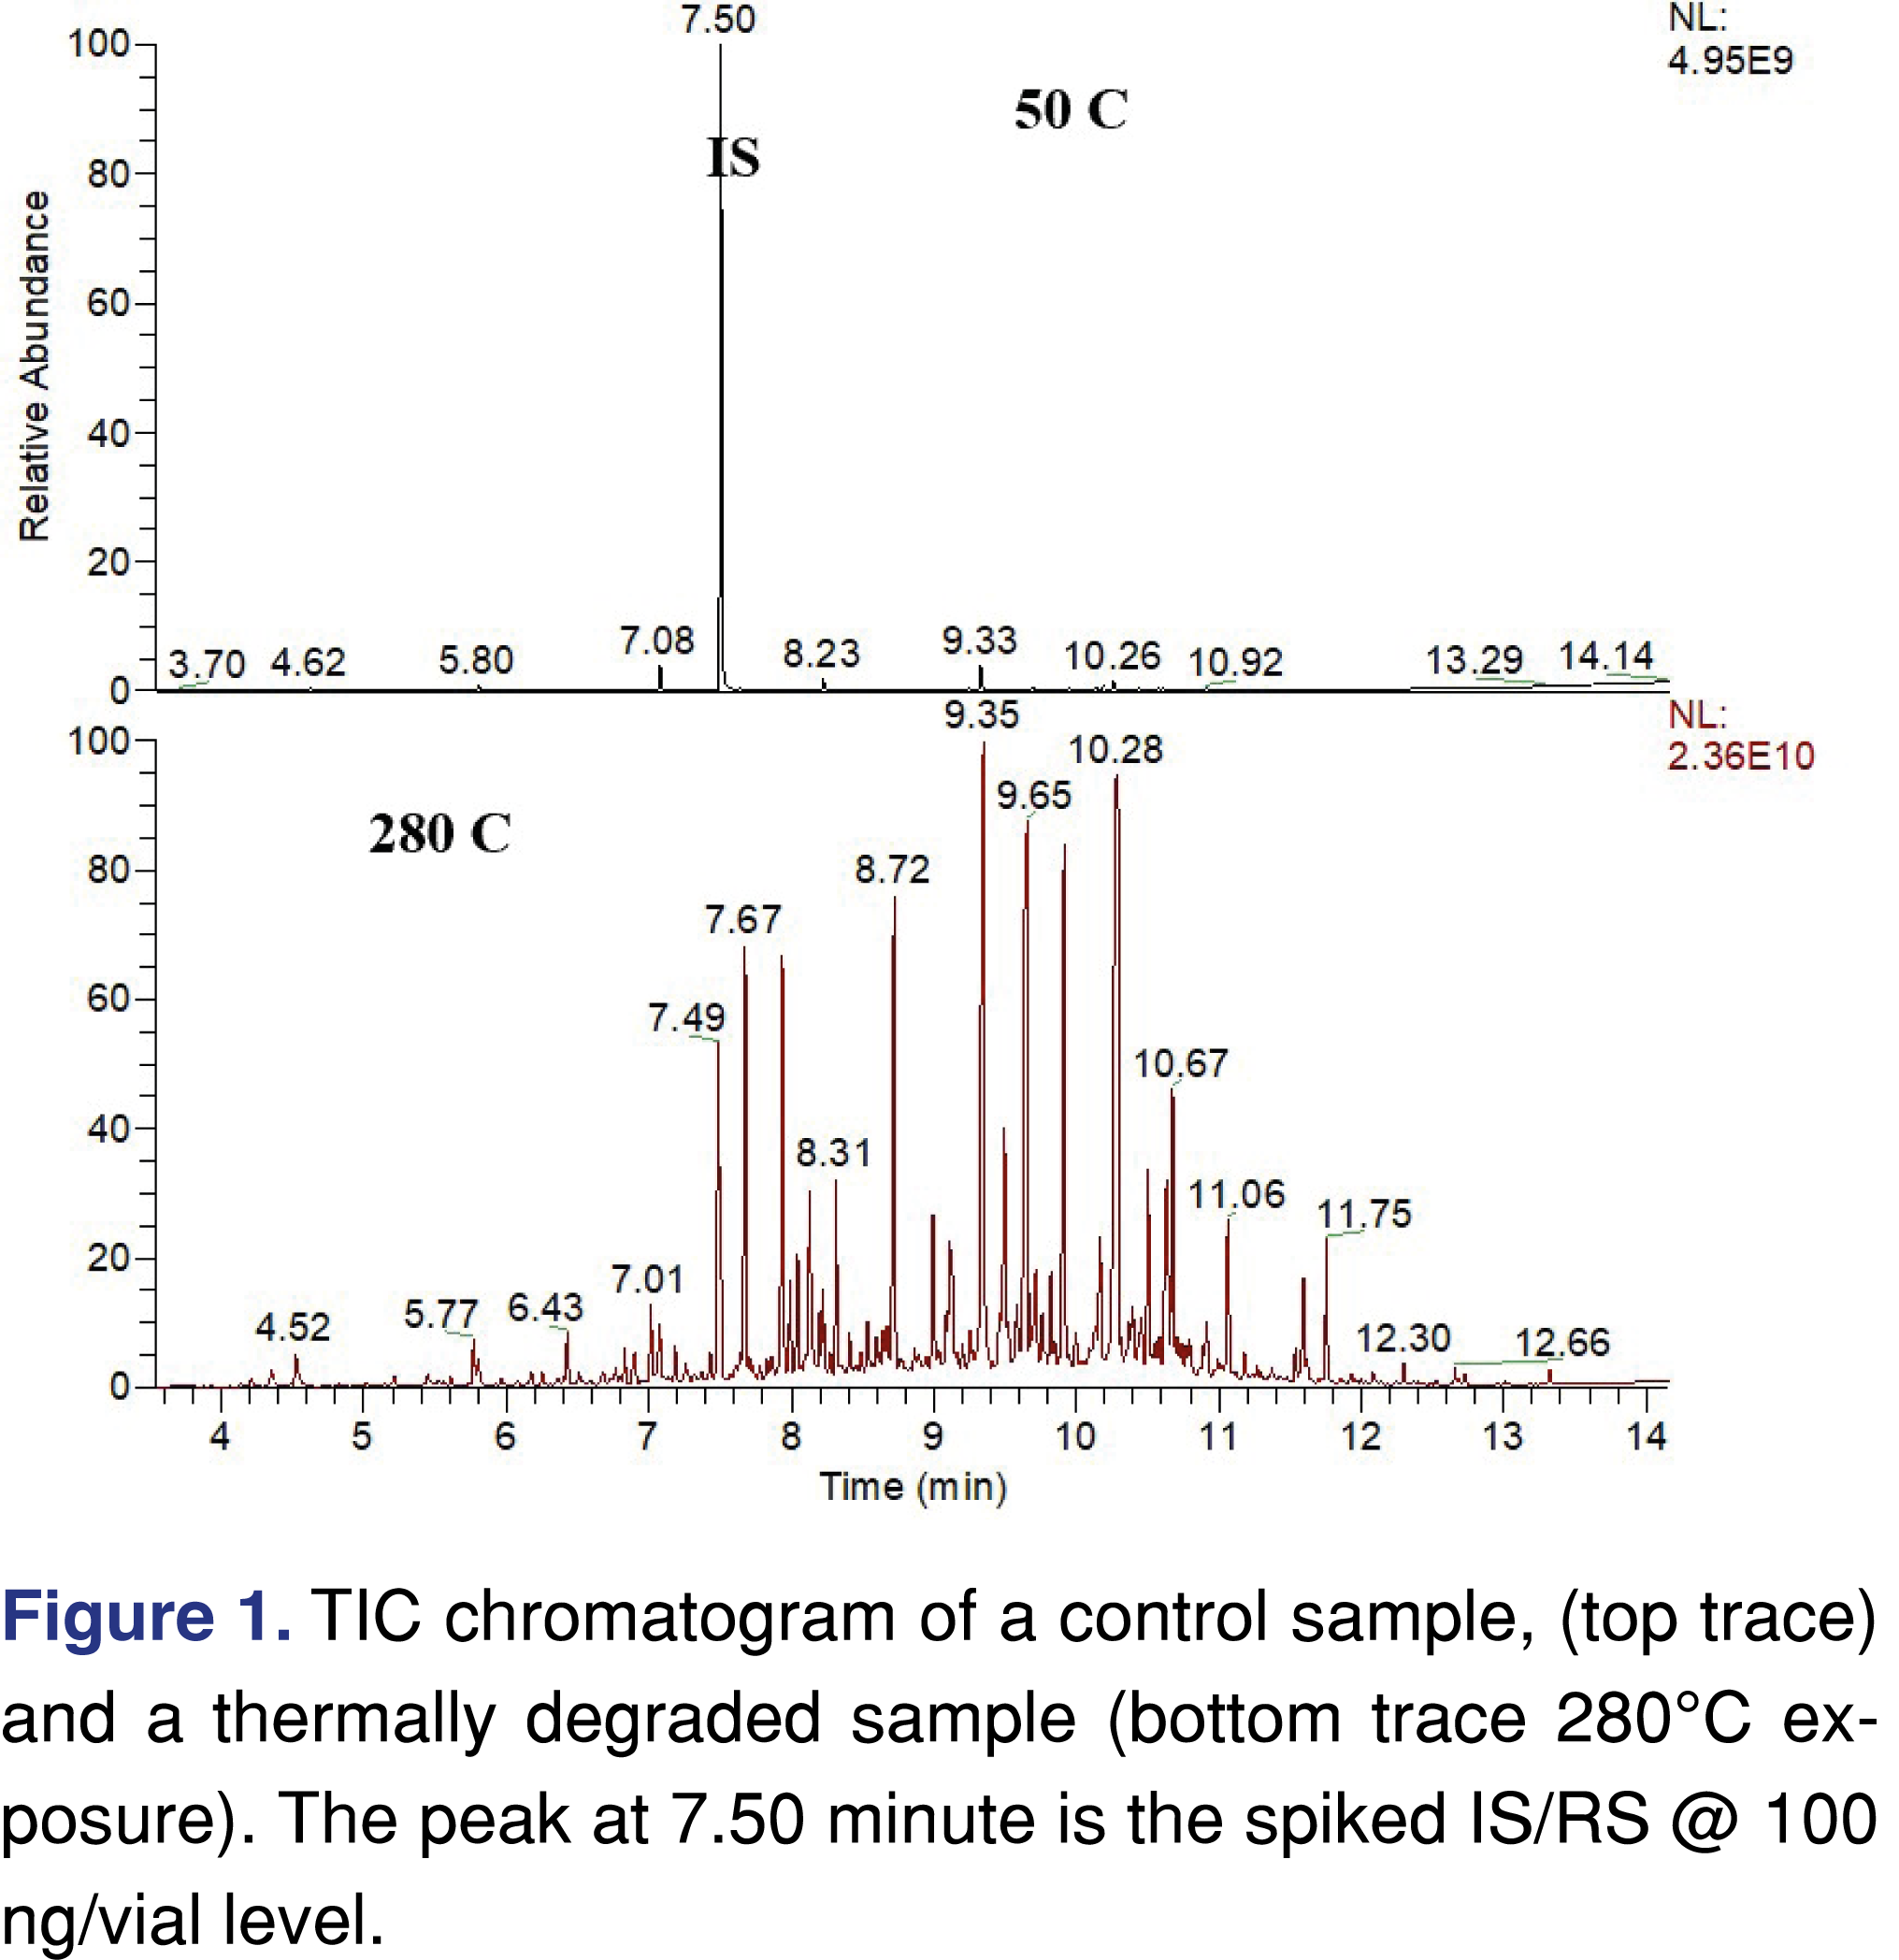
The TIC chromatogram of a non-degraded sample versus the sample exposed to 280°C temperature is presented in Figure 1. While the sample which was not exposed to elevated temperature conditions (used as a control) shows a low level of volatile degradation products (in a magnitude of less than 10% of the IS peak intensity), the high temperature exposed sample shows a significant a level of volatile degradation species. More than 25 different chemical species were observed above the level of 540 µg/day exposure level. Additionally, more than 100 volatile degradation species were observed. However, since they were below that particular limit, they were not identified. If a more conservative 0.15 µg/day evaluation limit would have been used (if the study were executed to follow special safety concern limit used in the pharma industry for inhalation-based pharmaceuticals) the identification process would require years of research. The full identification of the low-level analytes was not the main purpose of the study as it can be done at a later time since the data were acquired in scan data acquisition mode. Therefore data can be re-processed and re-evaluated at a later stage of this research.
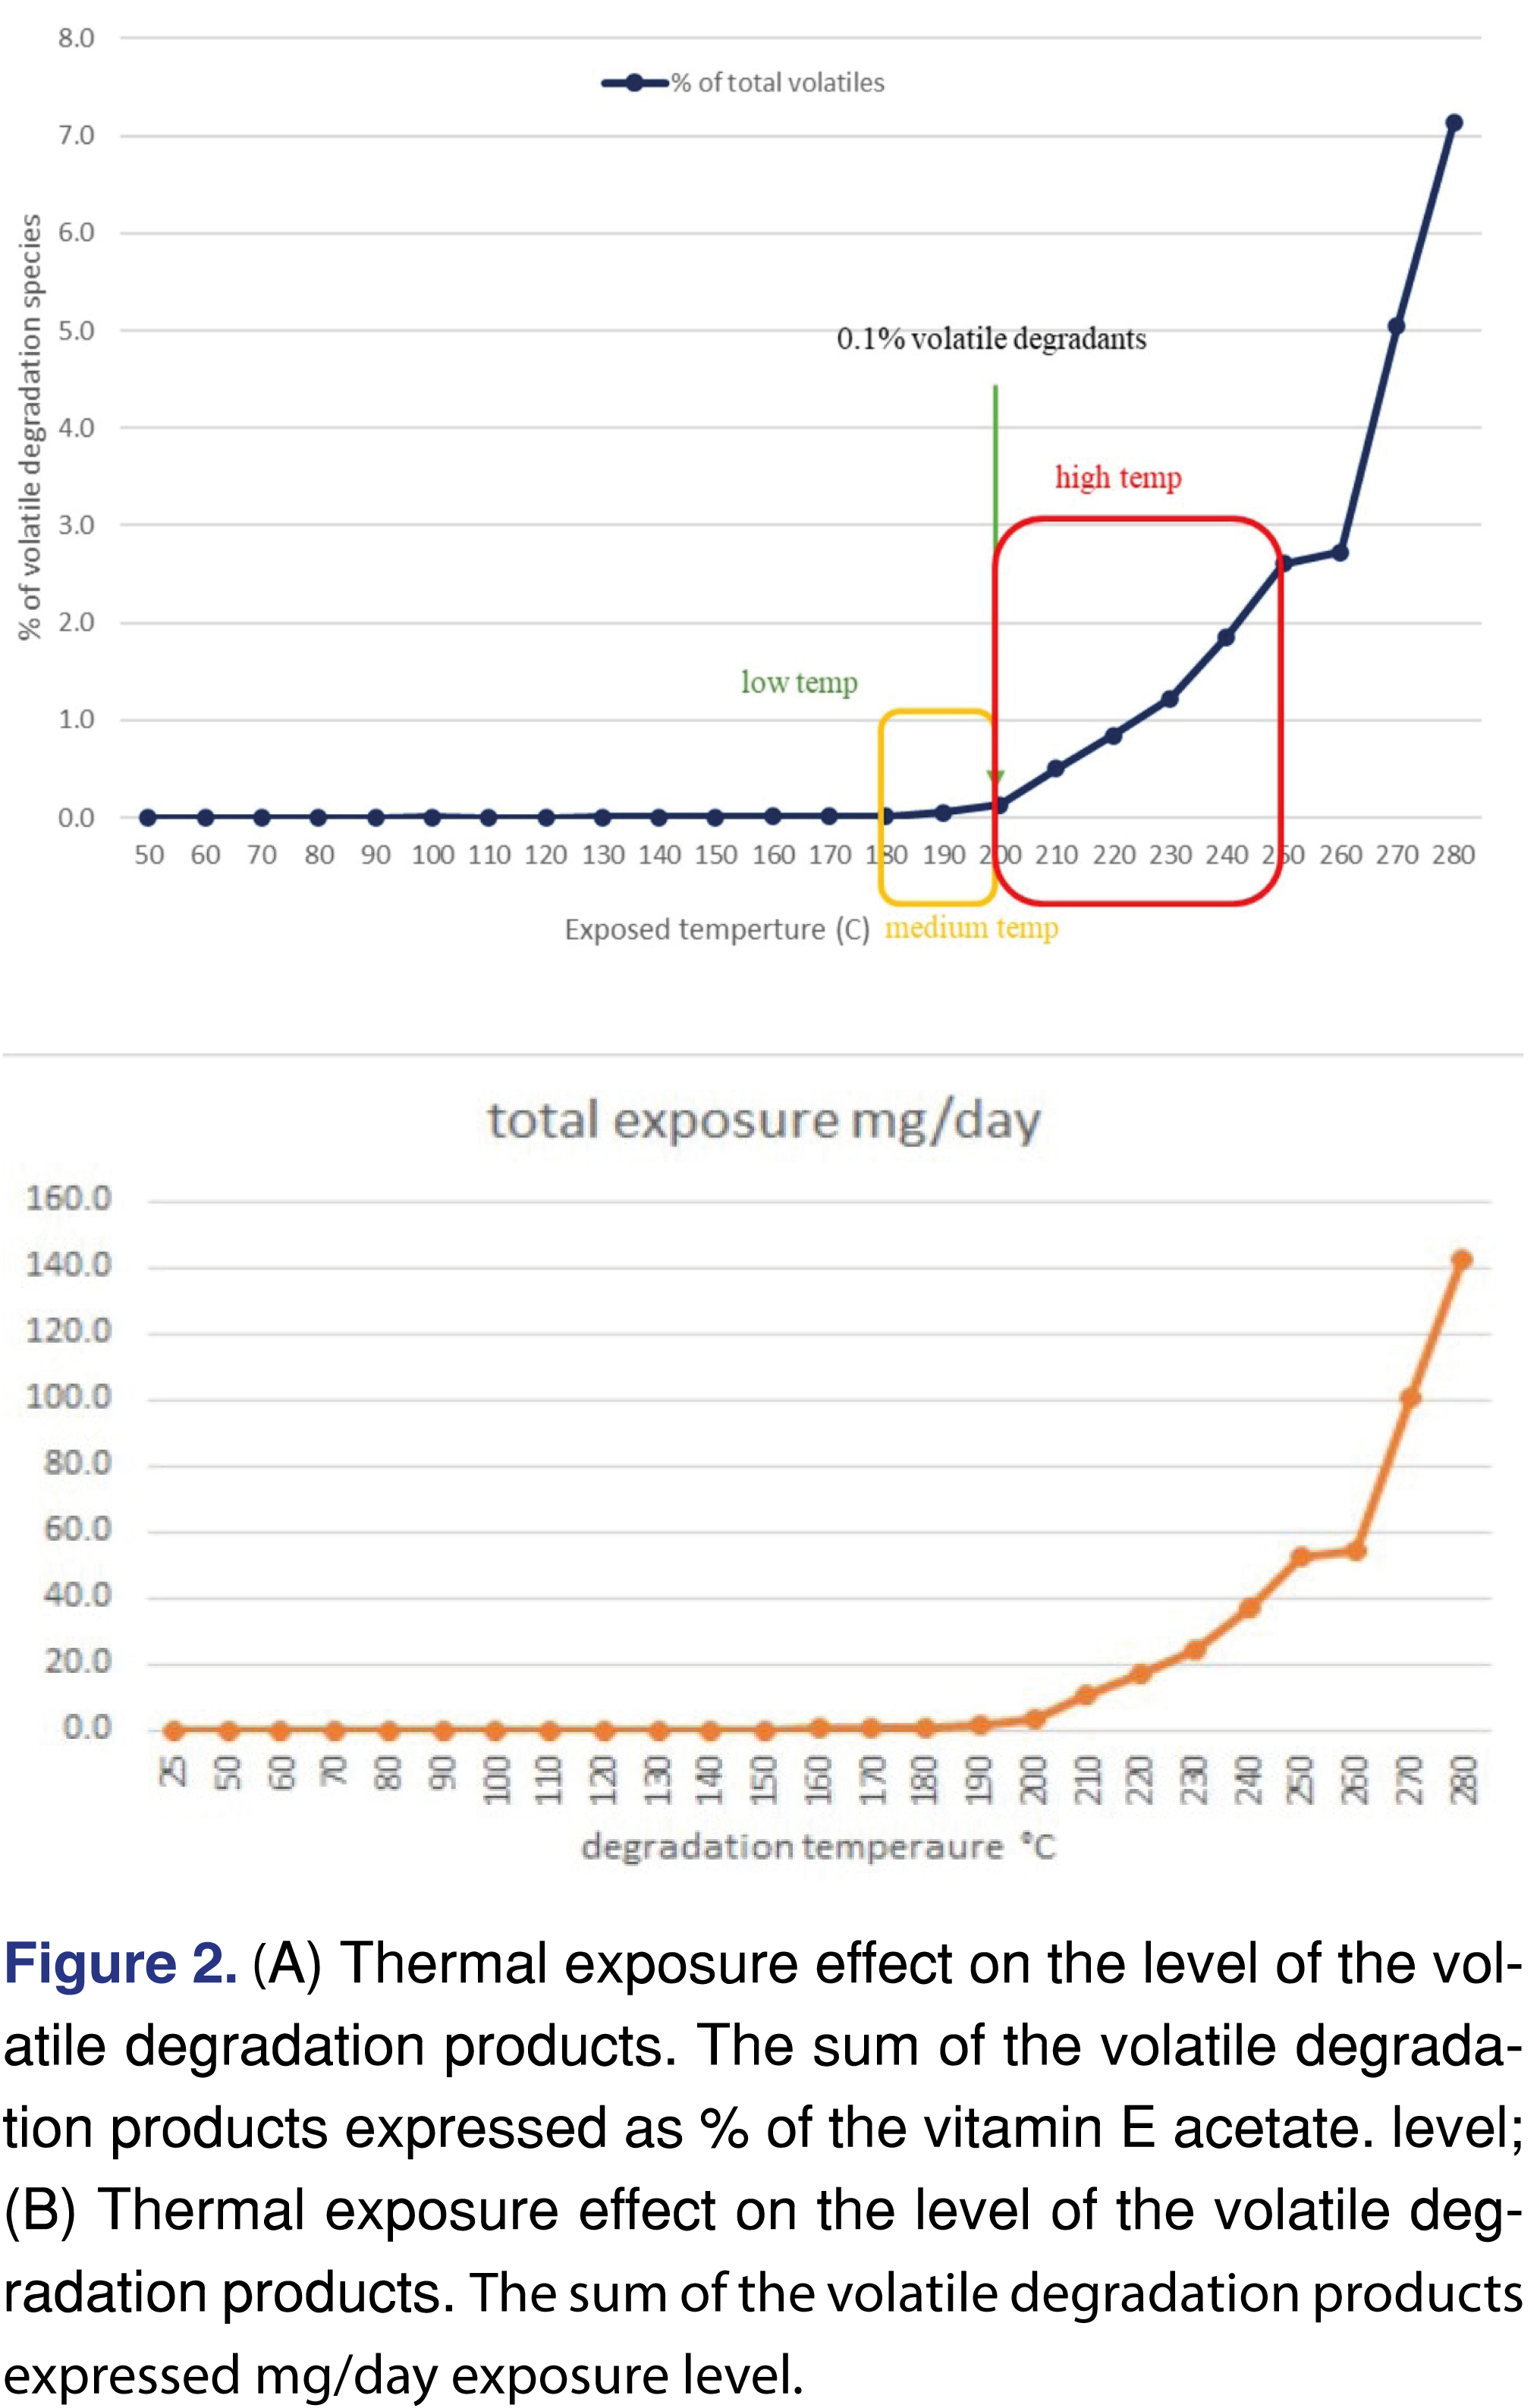
It was observed that there are multiple high-intensity peaks on the chromatogram associated with the 280°C temperature experiment, as this highest study temperature the degradation of the VEA slightly above 7% calculated based on the sum of the degradant peaks, which is a considerable level of thermal degradation. The forced degradation guideline of ICH Q1B, recommends conditions which, generate degradation species in a range of 5-20%, and the 7% observed degradation is within that range. The plot in Figure 2a shows that the formation of the volatile degradation products below 200°C is negligible and the formation of the degradation products above 260°C shows almost exponential growth. The sum of the degradation peaks reaches 0.1% level at 200 °C, and both the numbers of the degradation products and the amount in the head-space is starting to elevate above that temperature see the data presented in Table 1 and Table 2. Based on the level of the degradation product a daily exposure level can be estimated using the assumptions explained above. The overall daily exposure presented in Figure 2b and at the highest temperature can be as high as 140 mg/day.
The vaporizers available on the market use different temperature settings for vaporization: as 180°C is the region of the low-temperature vaporization, 180-200°C range is the medium temperature, while the 200-250°C region is the high-temperature vaporization in general terms [30,31,32]. The lower temperature obviously associated with a lower rate of vaporization and potentially lower-level thermal degradation products, and some of the flavors may not release at the lower temperature. It is important to note that the low-temperature range is below the boiling point of the nicotine while it is above the boiling point of Δ9-THC. It does not necessarily mean that during the “vaping” process the chemicals were not exposed to a higher temperature [11] as there is no guarantee the heating element has a homogenous heat zone without any hotspots, or different models of vaping devices can be used higher temperature settings. Therefore it is highly possible that in an actual e-device, the degradation products could reach an even higher level, and/or different degradation products can be formed.
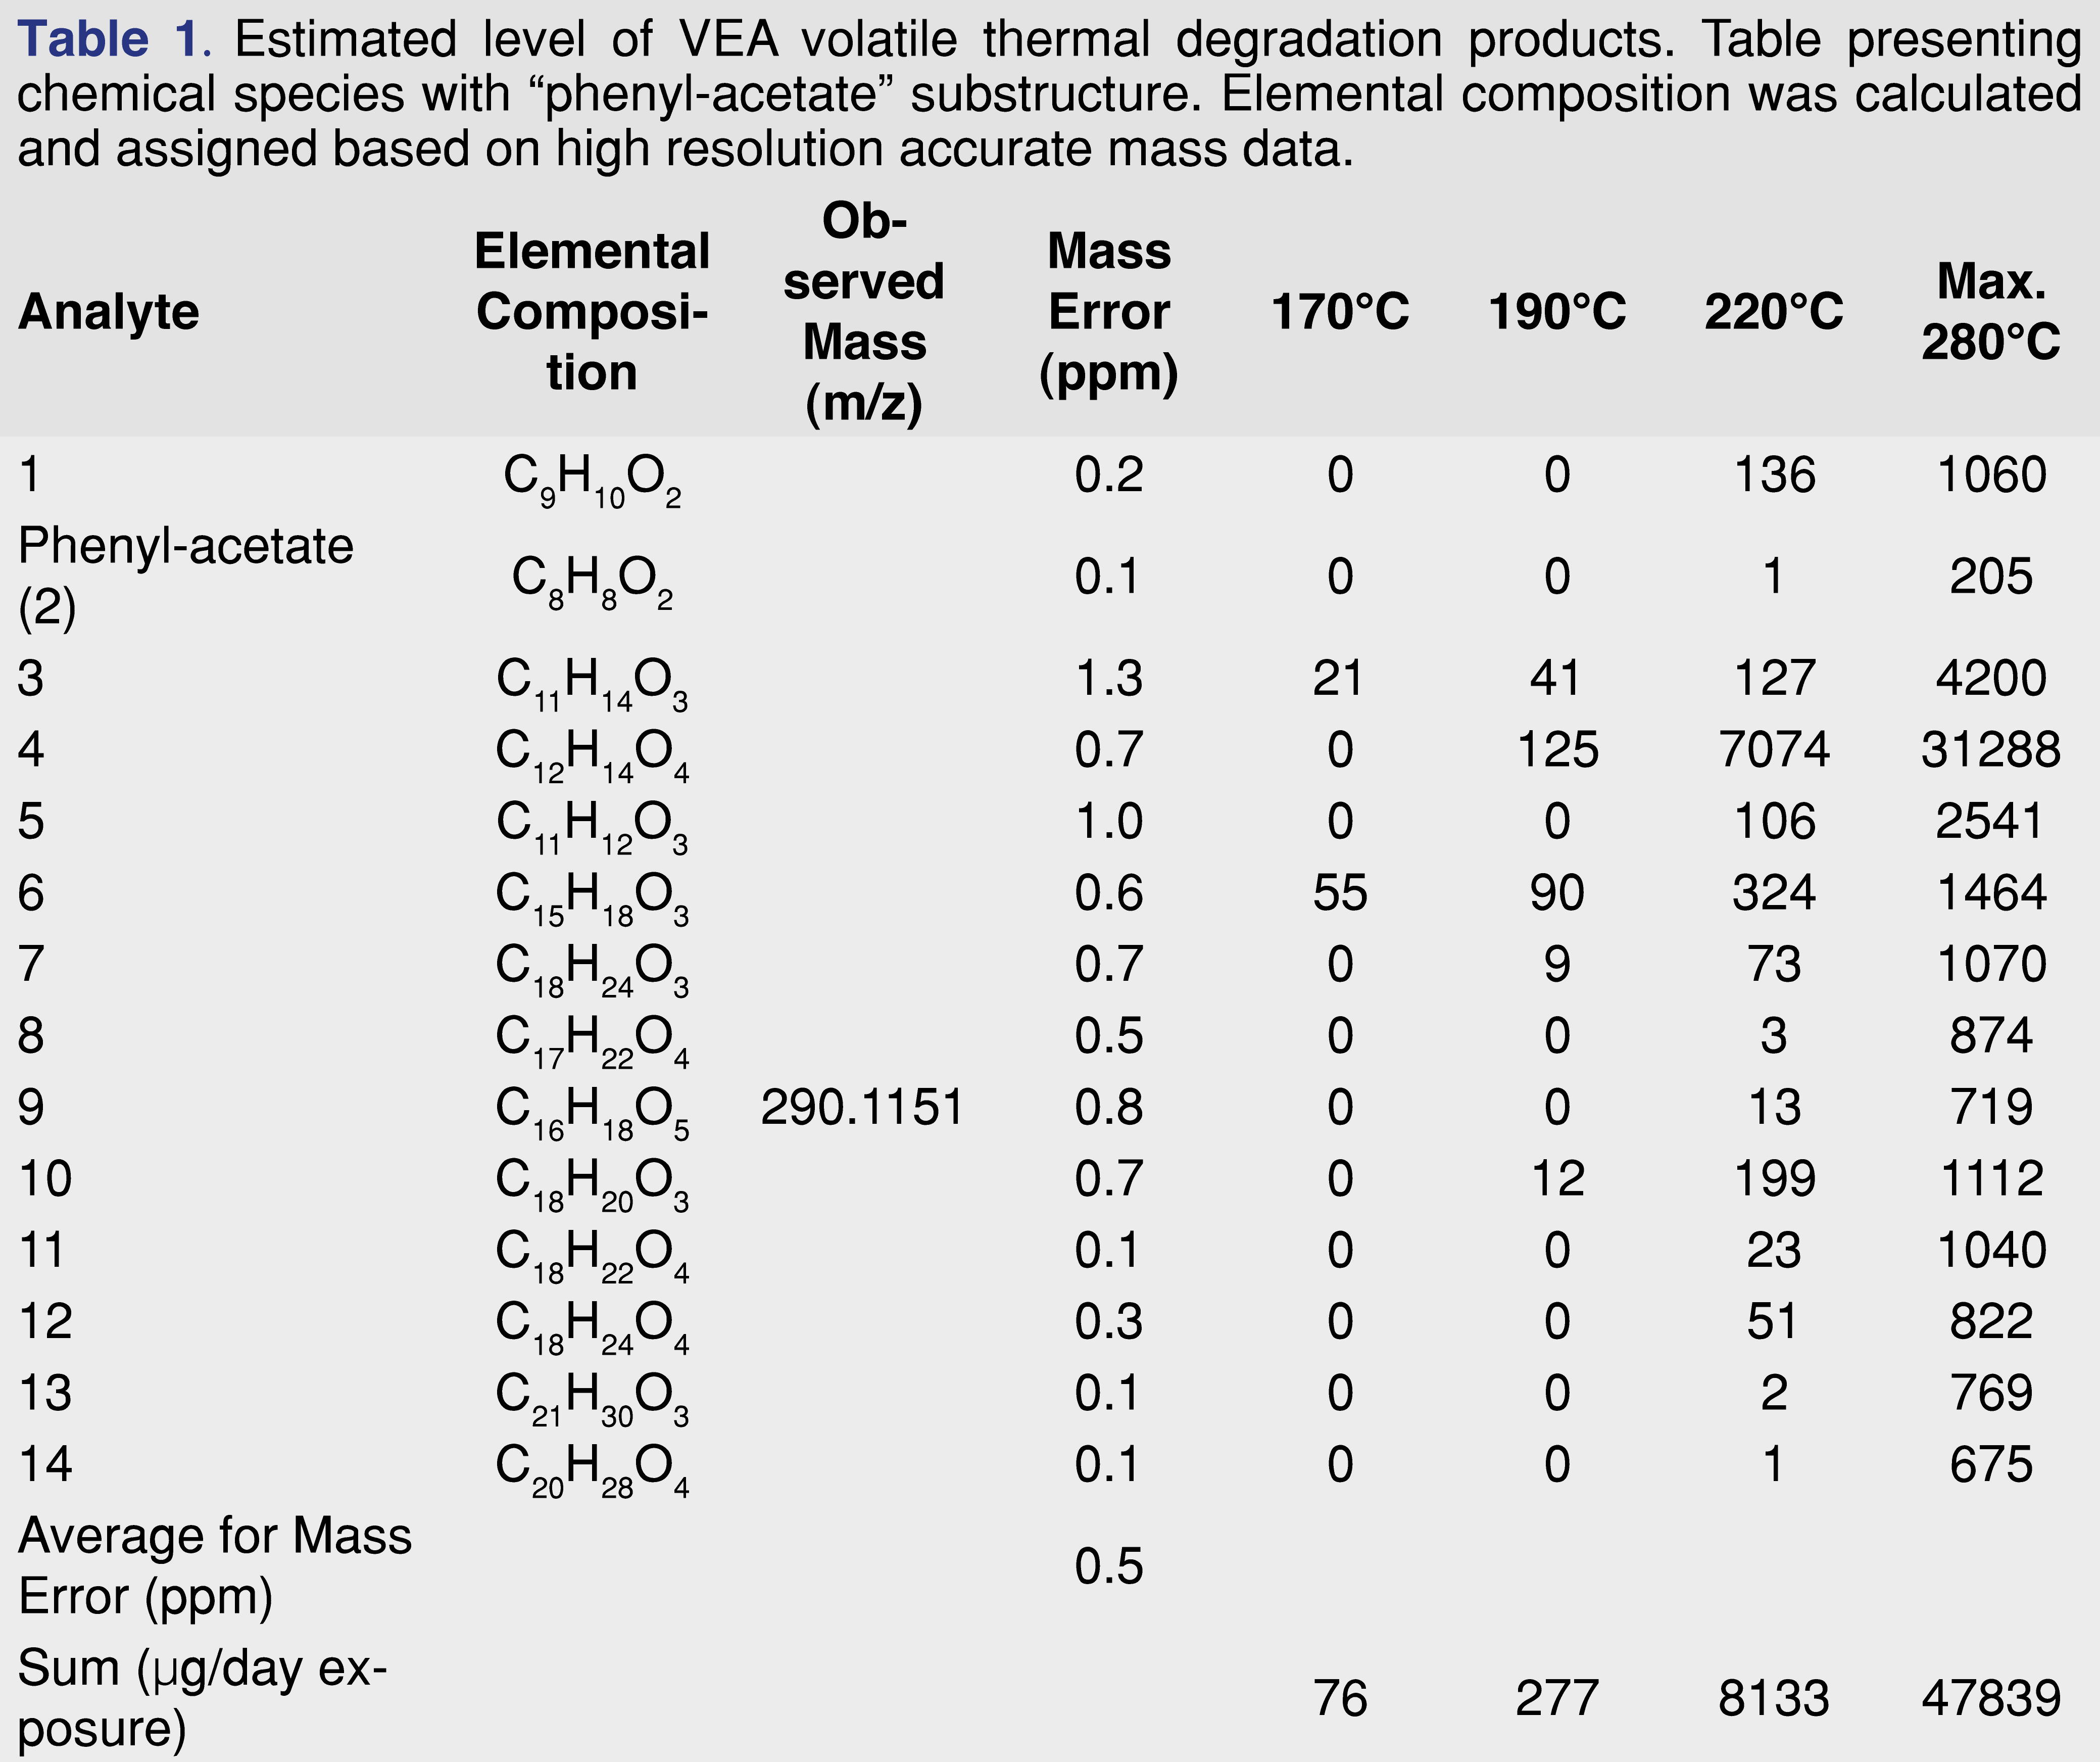
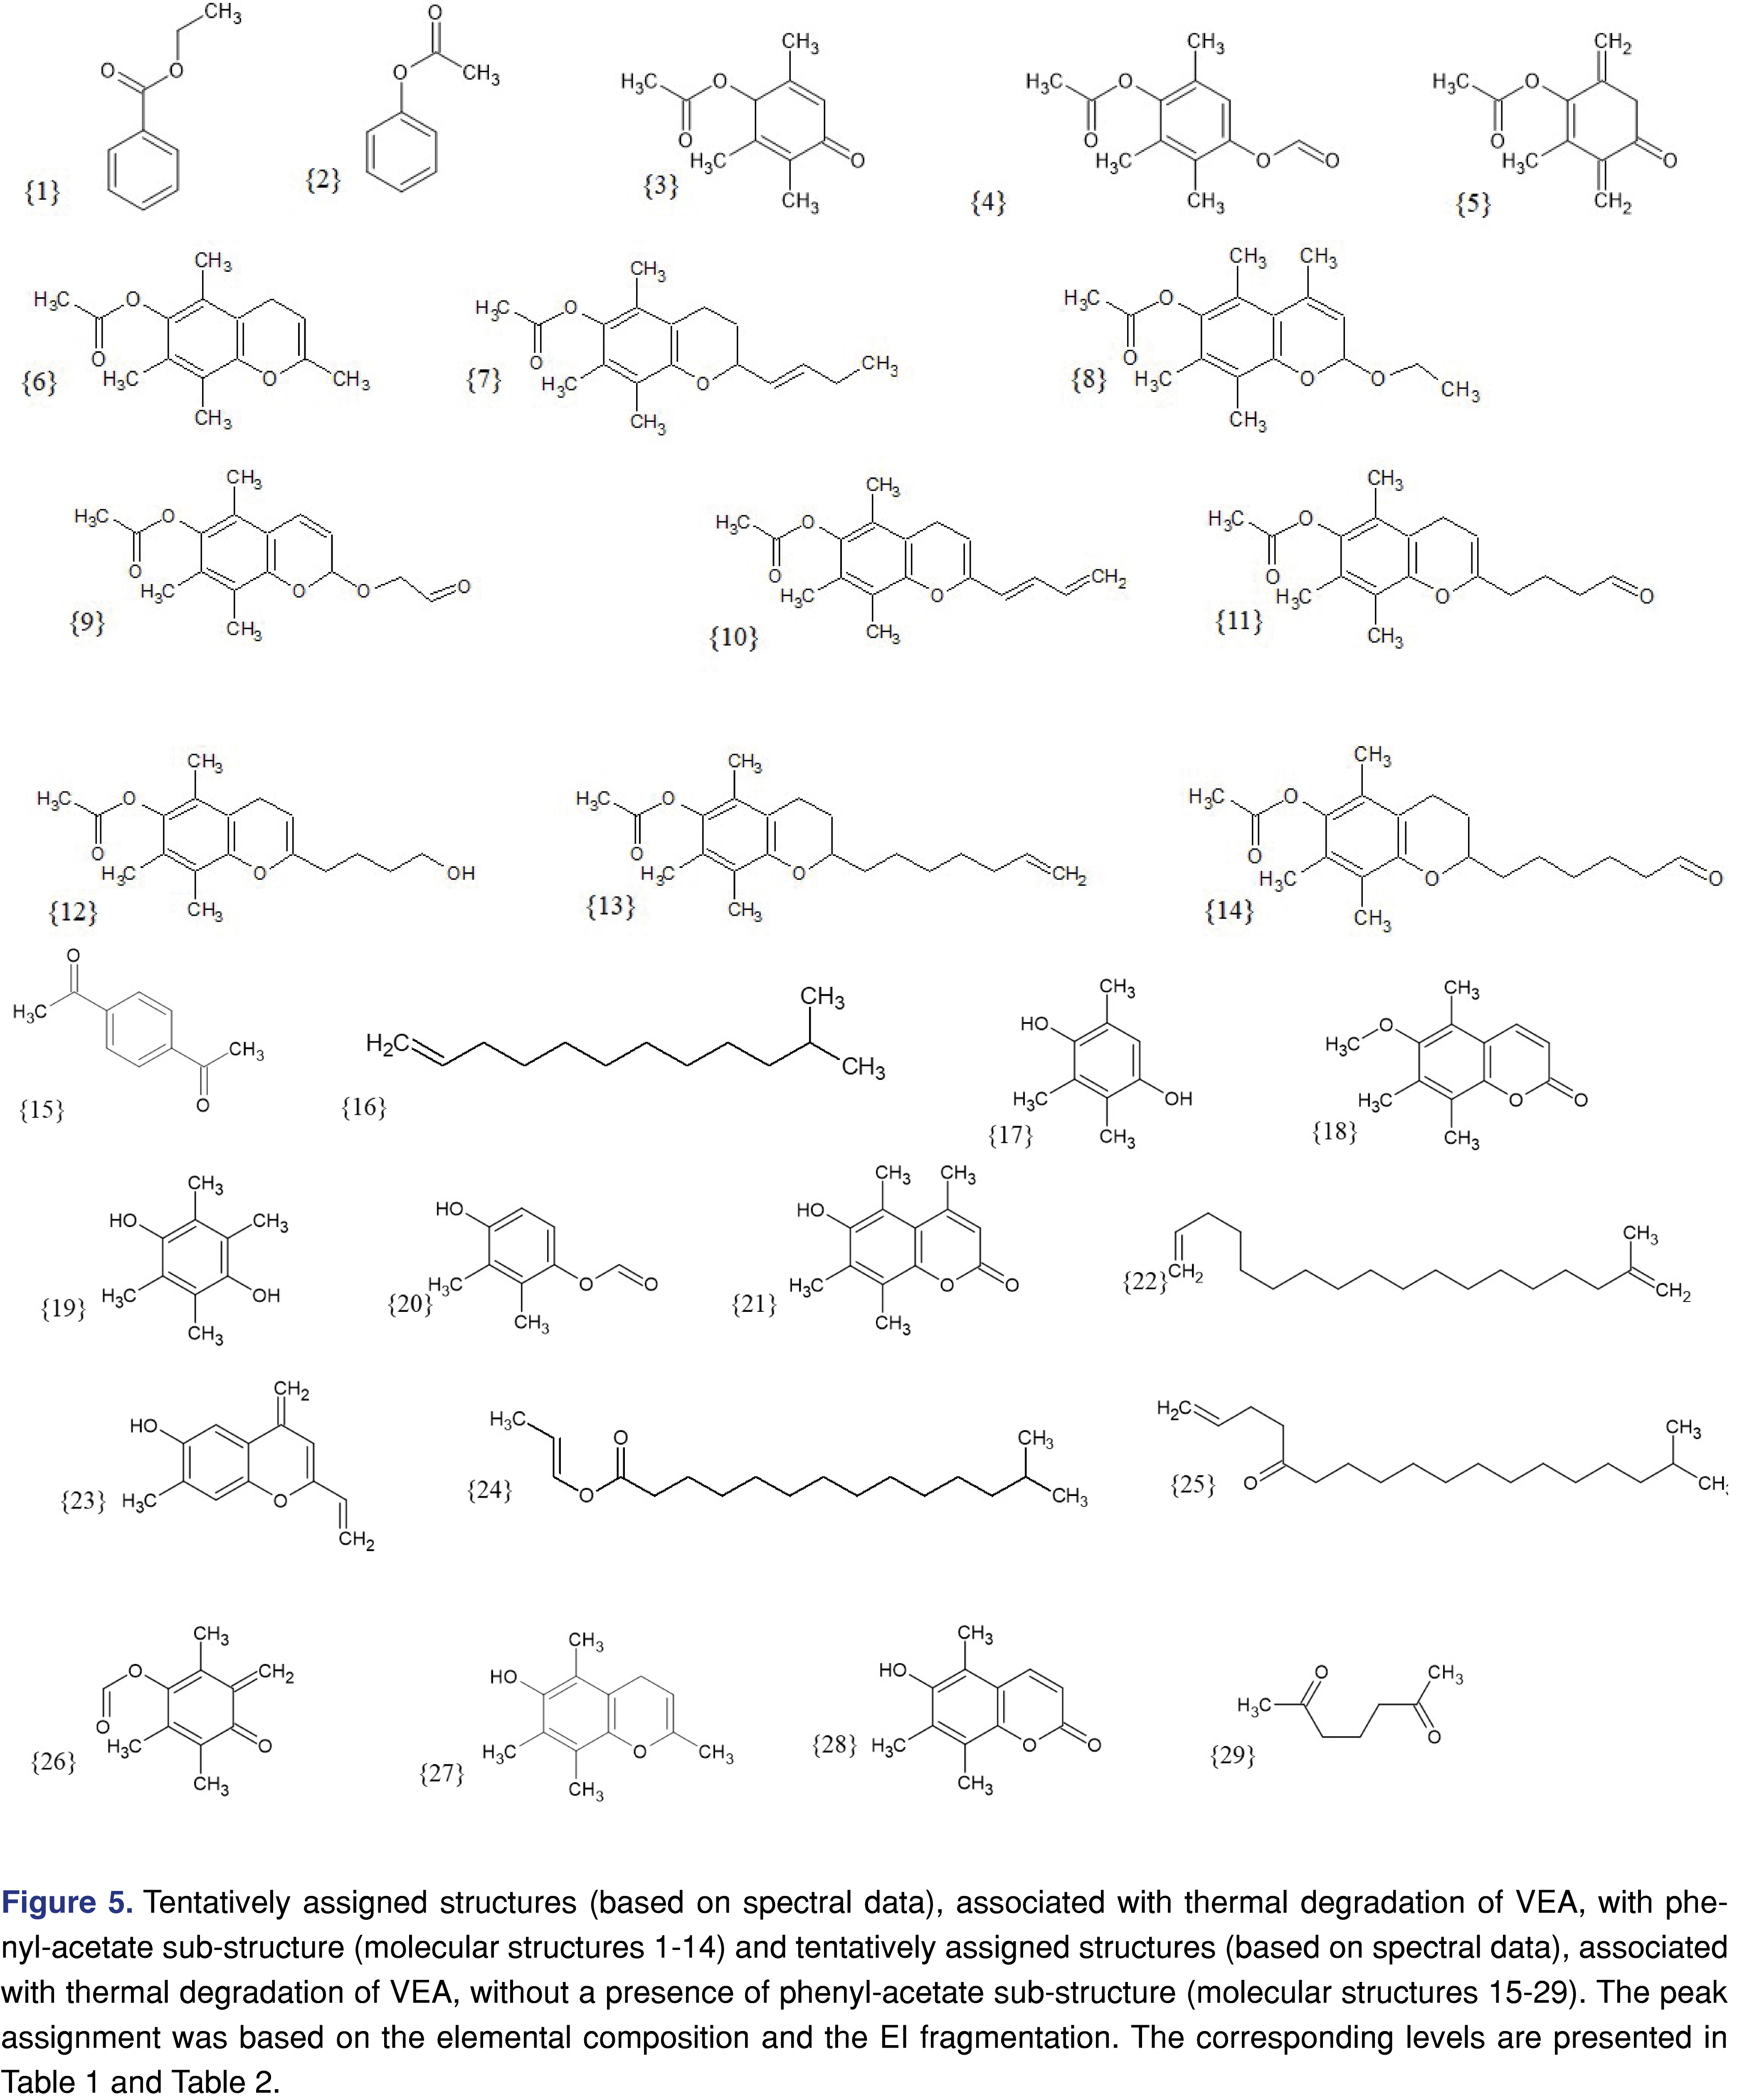
There is limited availability for the chemical assessment of VEA volatile thermal degradation products and the data sets are not directly comparable since the thermal procedure was different for the two studies [18,46]. Also, the sampling technique and the analytical instrumentations were different and therefore the reported degradation products do not show complete overlap between the published studies. In the application note [46], static headspace was used with a unit resolution mass spectral detection and the majority of the reported analytes were low molecular weight (below m/z=200). The identification was limited to spectral libraries based on unit resolution data. In the referenced research paper [2], the focus of the study was to look for potential ketene precursor species and the authors used LC-MS with HRAM detection as well as GC-MS with unit and with high resolution. This paper presented evidence that the high temperature (pyrolysis temperature) degradation products of VEA and the vitamin E acetate itself may produce ketene as a pyrolysis by-product. The fragmentation pattern that was proposed for vitamin E acetate either follows the route of direct elimination of a ketene, producing duroquinone and short-chain alkenes as main degradation products, or goes through the formation of duroquinone acetate and a hydrocarbon chain (C19H38). Additionally, the duroquinone-acetate forms duroquinone and a ketene [2]. Based on the proposed fragmentation patterns, both patterns end up in a ketene elimination, which may have been associated with the negative health effects experienced in e-device users. The volatile degradation products identified in our experimental conditions show some similarity to the data published in PNAS [2], as 14 different species were tentatively identified to show a phenyl-acetate sub-structure, while the other 15 species are not carrying that function. It is important to note that all of the structural assignments are tentative and were based on the spectral fragmentation and the elemental composition of the observed molecular ion(s). It is important to state that mass spectrometry is a high-performing, multi-use analytical tool and it has limited structure elucidation capability. Unfortunately, it is not an absolute structure confirming technique and thus the term “tentative” is used for identifications. For confirming the proposed structures, NMR should be used which would be very difficult in connection with a GC-based separation [47].
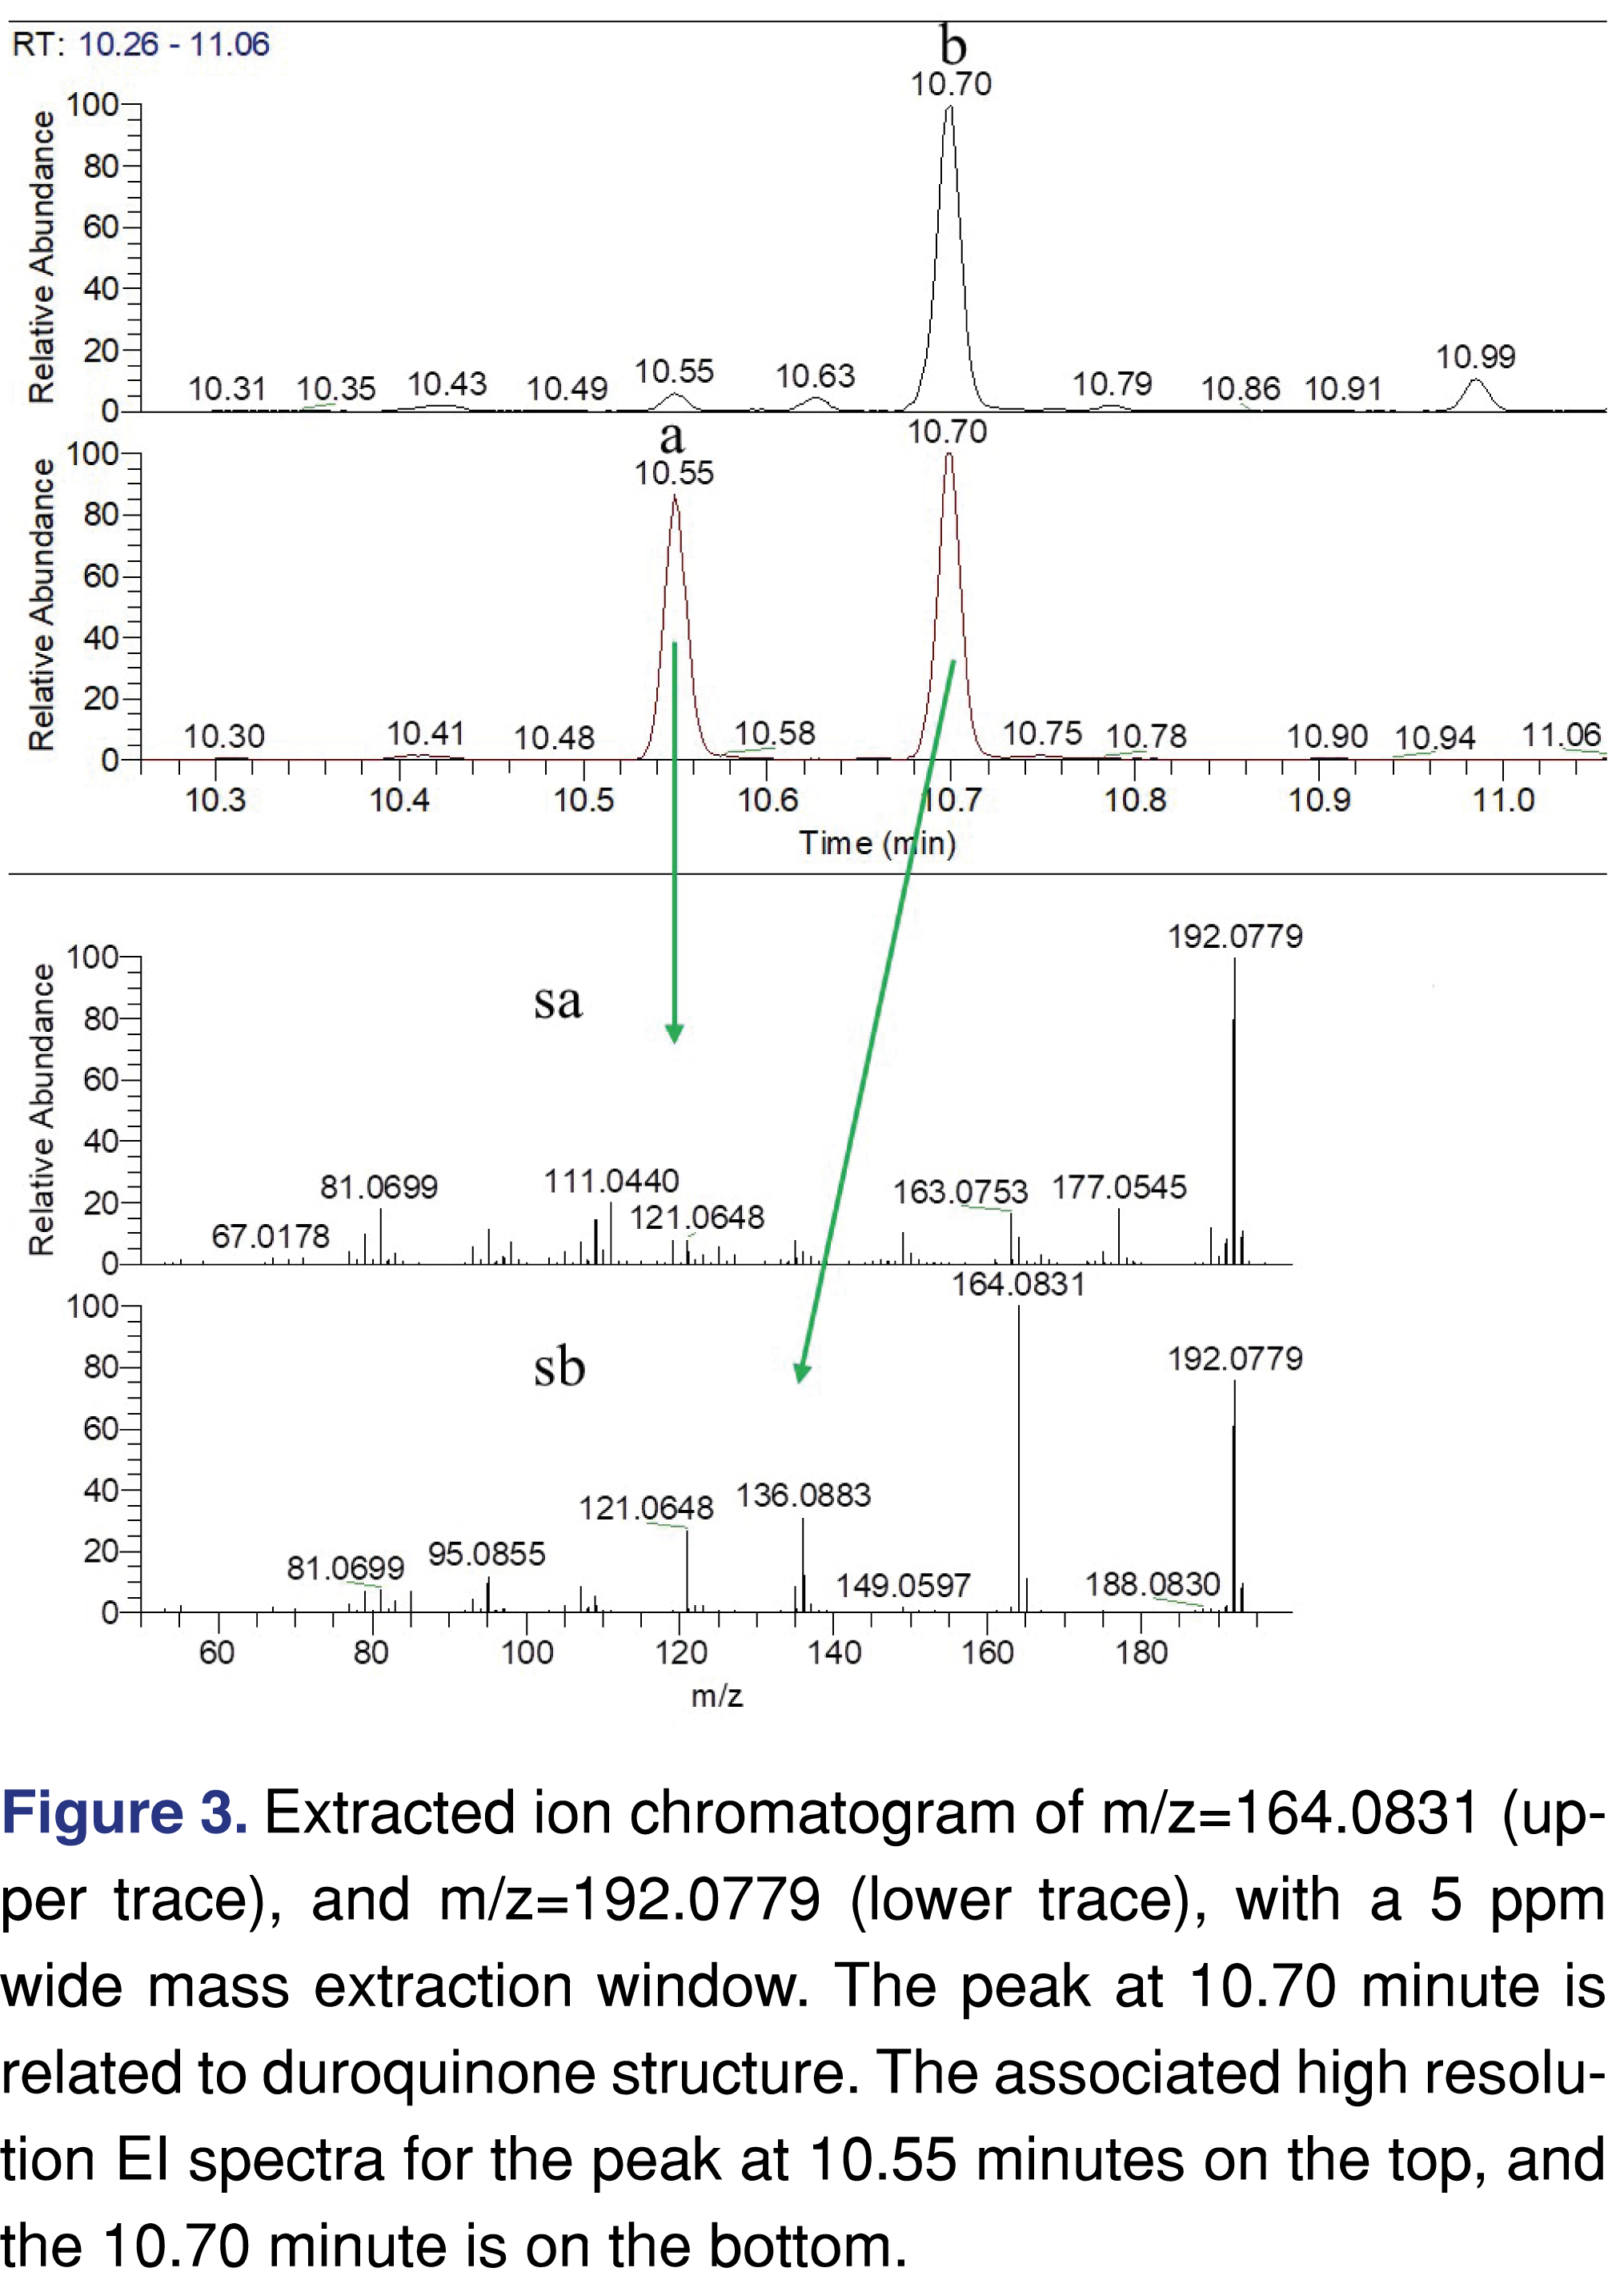
In our study, the thermal degradation conditions did not reach the pyrolysis temperature, therefore it was expected to see different degradation products [18], however, our expectation was to identify species that were formed both at the pyrolysis and the lower temperature exposure [18]. As the data collection was completed, one of the 1st actions was to look for the specific molecular markers of m/z=164.0831 for duroquinone and m/z=206.0937 for duroquinone-acetate, as they were reported as significant ketene produced degradation products. There is a single major peak and a few small peaks in the chromatogram for the extracted ion of m/z=164.0831 at 10.7 minutes retention time (Figure 3b). However, no peak was present for the trace of m/z=206.0937. The spectra associated with the peak at 10.7 minutes showed a base peak ion for 164.0831 but this was not the molecular ion. The molecular ion was at m/z=192.0779, which is associated with the elemental composition of C11H12O3 (a carbonyl C=O addition to the duroquinone) (Figure 3b). The extraction ion trace of m/z=192.0779 (Figure 3a) shows two intense peaks with significantly different EI spectra associated with the two peaks. The earlier eluting peak only shows a low-intensity peak of the duroquinone moiety but shows a significant loss of a methyl group from the molecule.
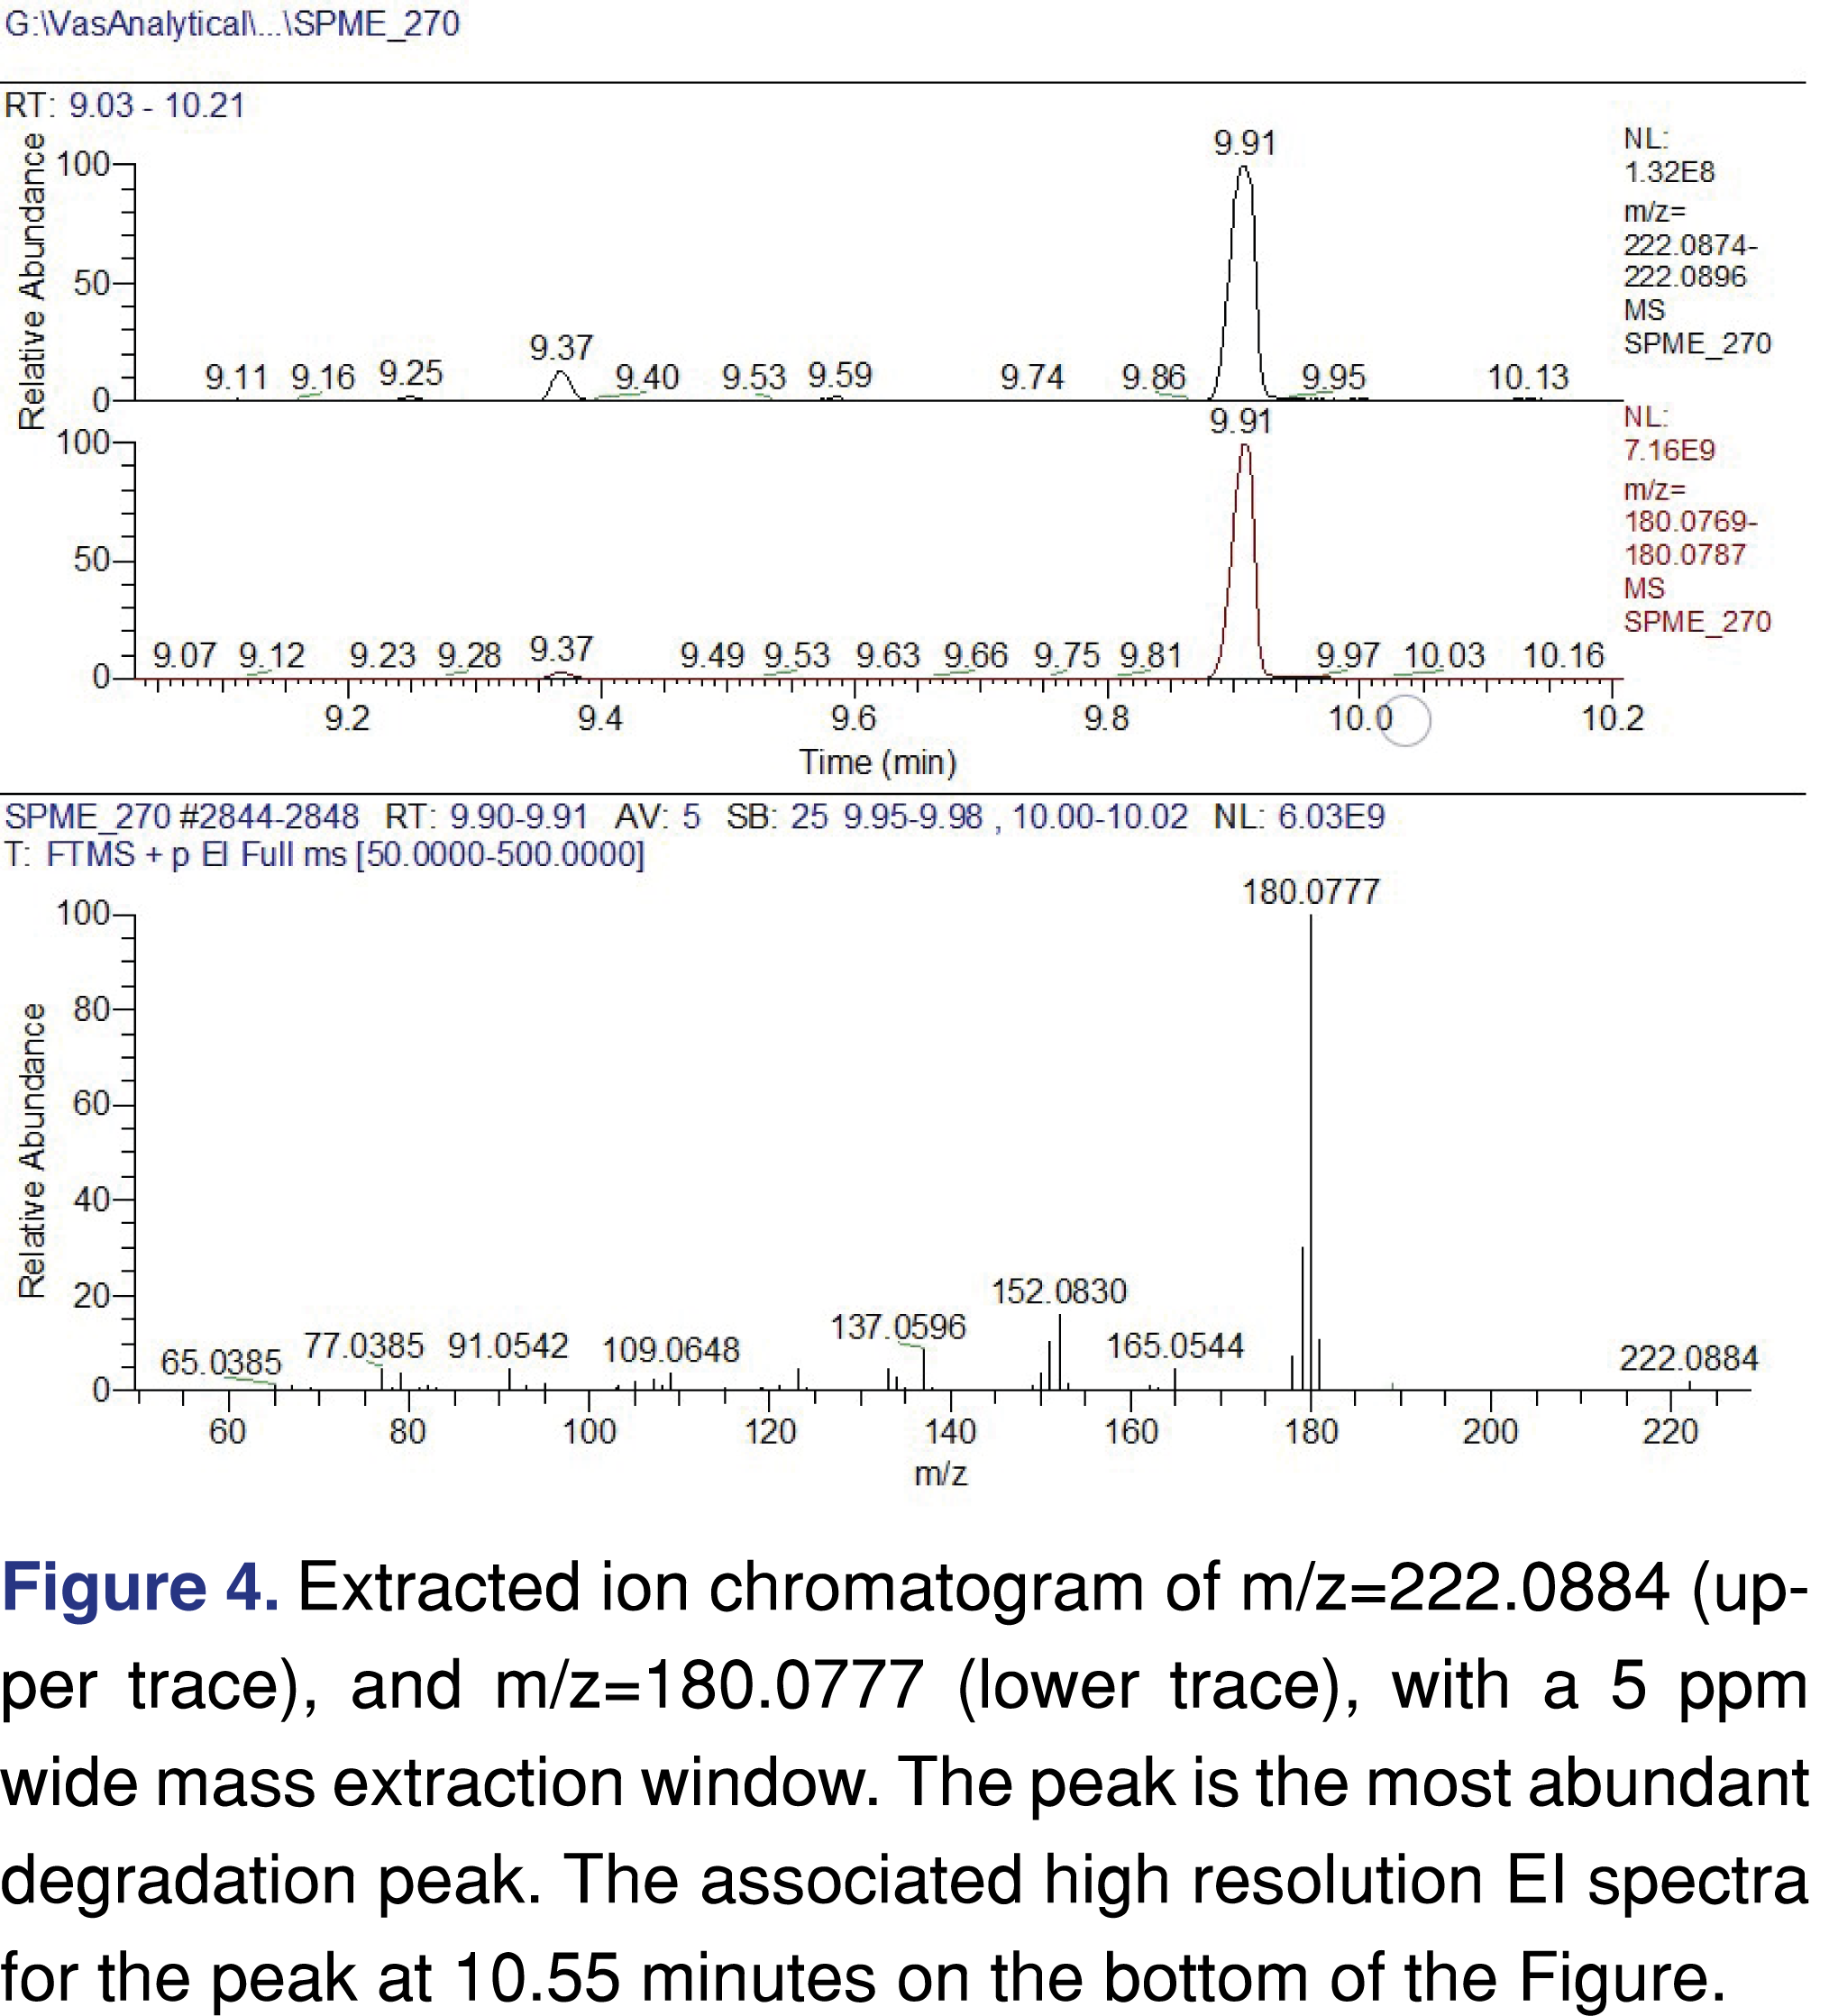
The experimental conditions being used in this study lead to a major volatile degradation product with an elemental composition of C12H14O4 with an associated mass of m/z=222.0884 with a spectral base peak of m/z=180.0777. The second most intense chromatographic peak was associated to a C13H26 hydrocarbon, which could be formed by a chain scission of the alkyl chain part of the VEA. The major degradation peak eluted with an asymmetrical peak shape, indicating a polar nature of the analyte as the peak has a slight fronting. The base peak of the EI spectra is associated with a C2H2O loss from the molecular ion indicating a presence of acetyl group. The base peak also shows further C=O loss from the molecule indicating the presence of an additional carbonyl group. Chromatographic and spectral data are presented in Figure 4. The extracted ion chromatogram shows almost perfect alignment for the molecular ion and the base peak ion, and the peak alignment combining with the spectral interpretation, providing strong evidence that they are associated with the same chemical entity, however, the possibility of a peak co-elution is still present, with a low probability.
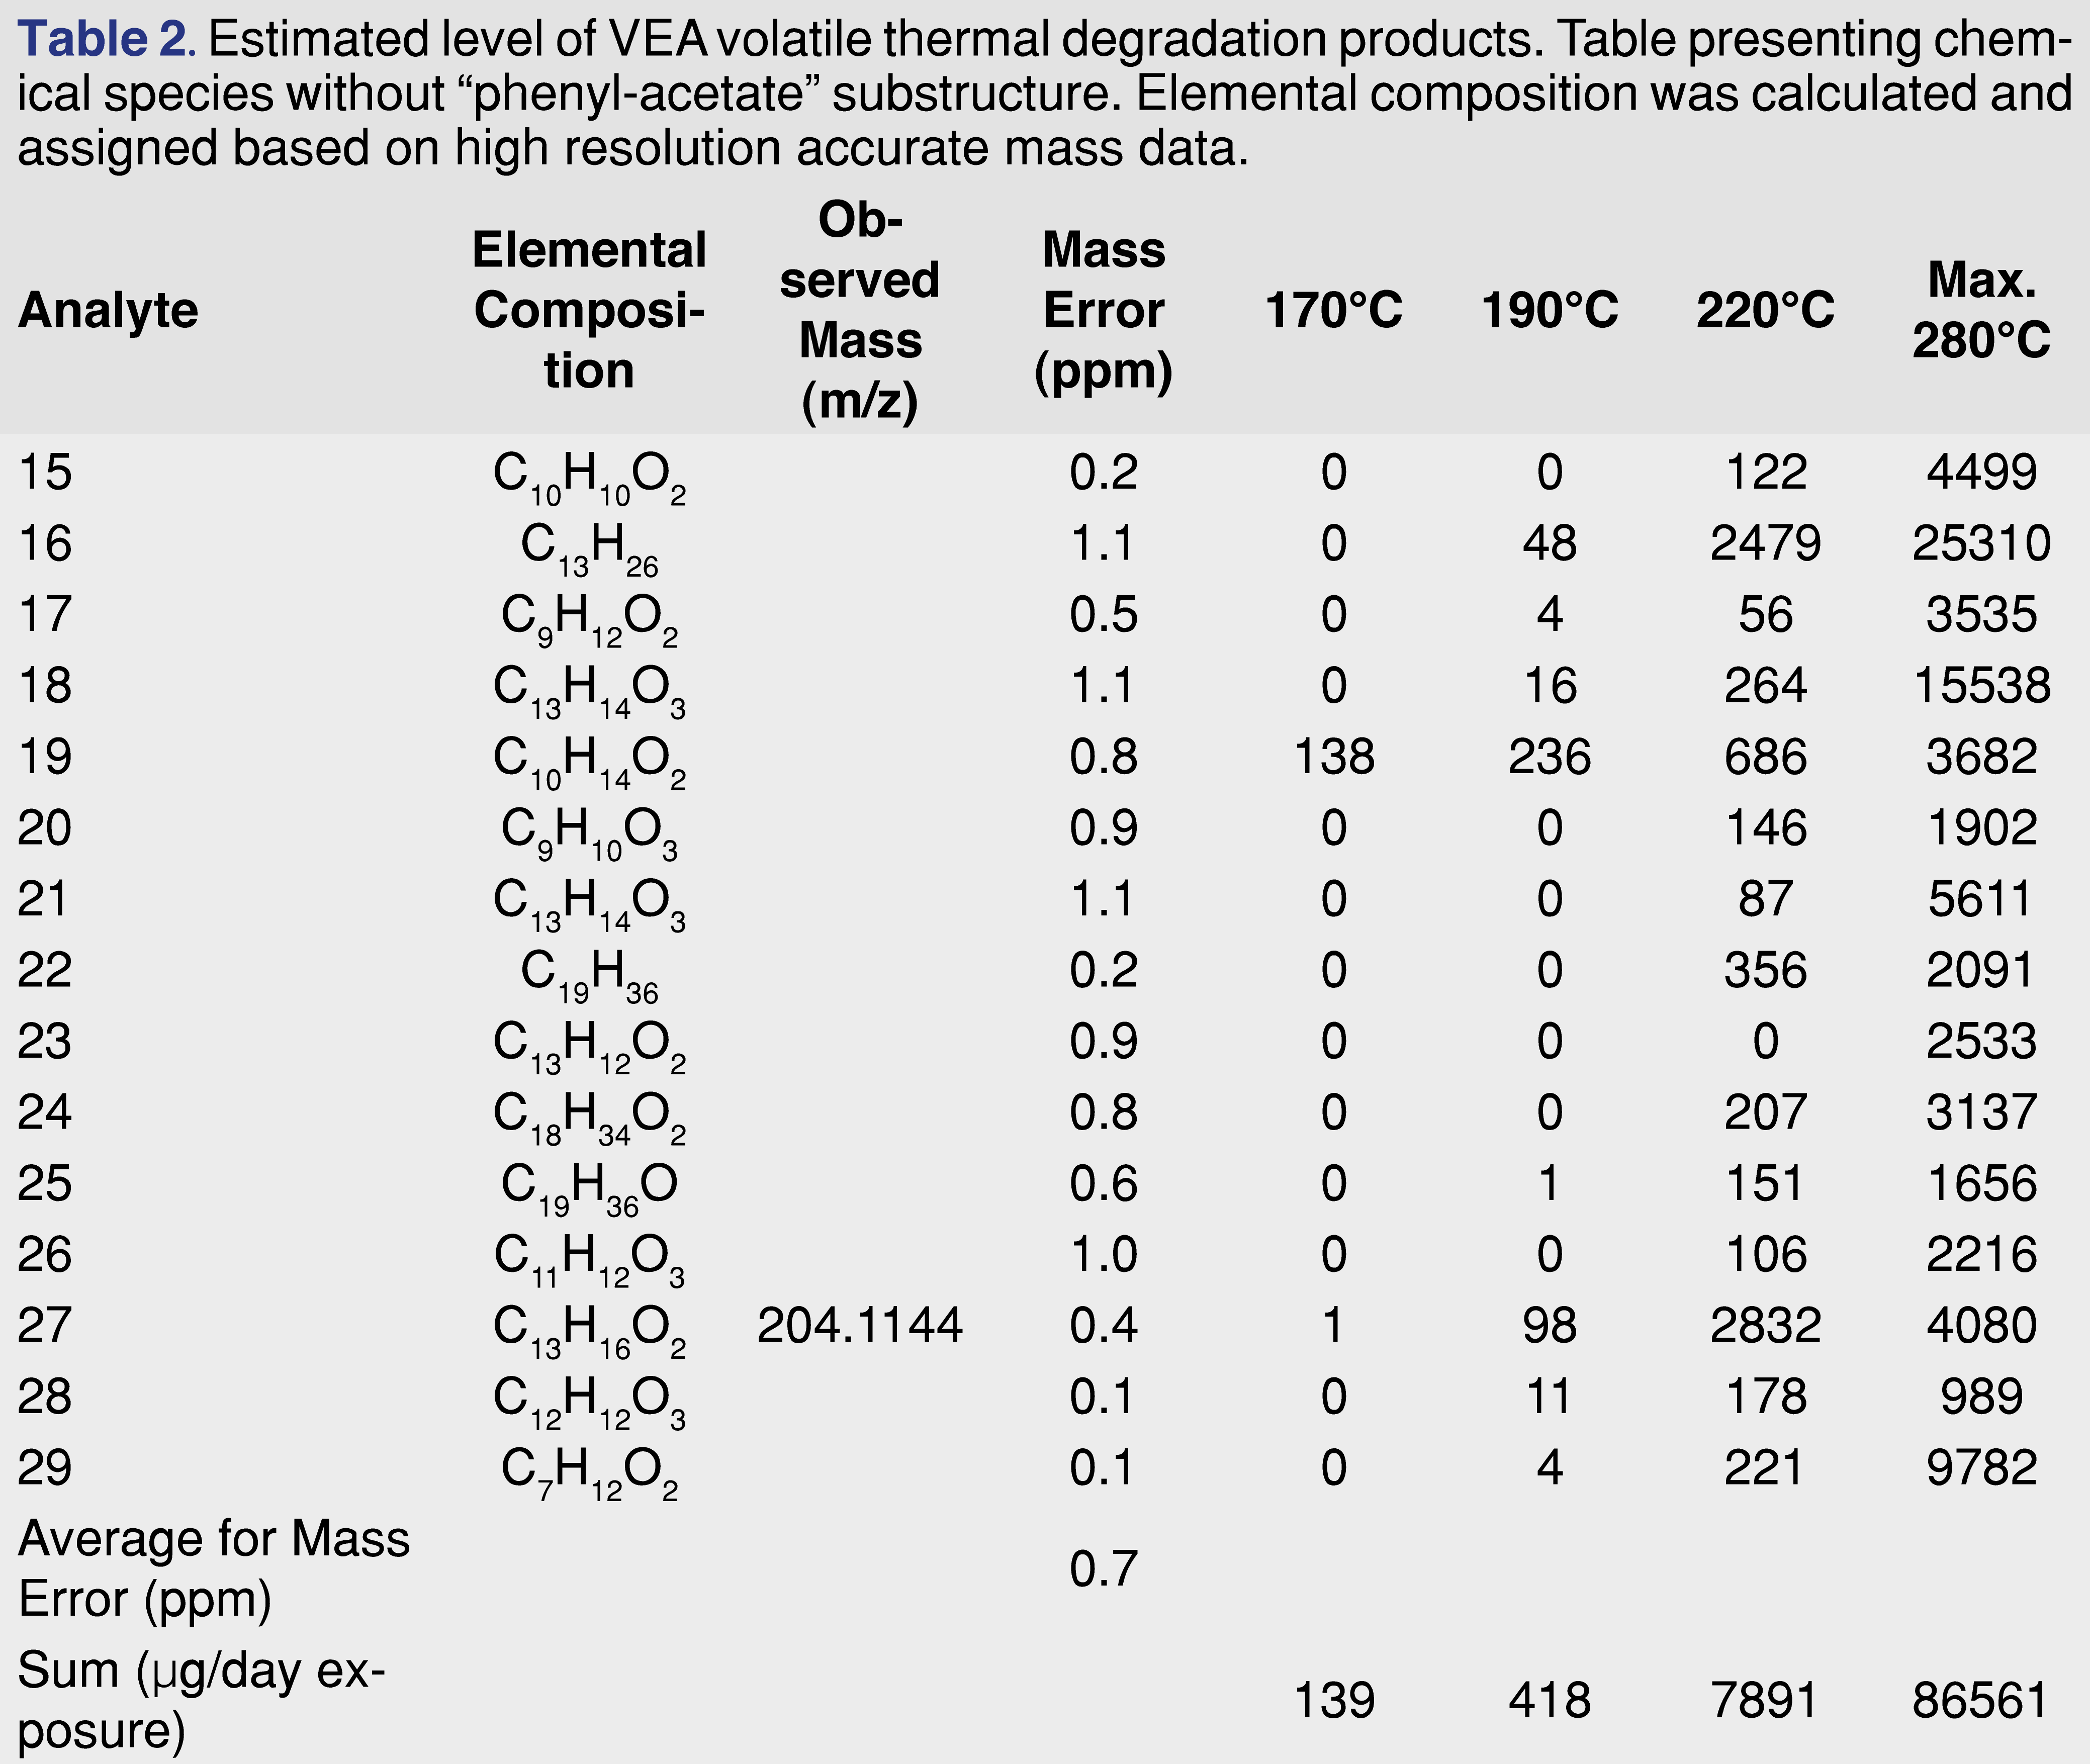
Based on the elemental composition and the fragmentation patterns an attempt was made to assign a tentative structure for all of the observed chromatographic peaks above the 540 µg/day exposure level. The structure assignment was necessary to have a preliminary toxicological screen for the degradation products using the Cramer classification system [48-51]. At this stage of the research, the Cramer system was only used to group the thermal degradation products, the toxicity of the individual chemical species has not been evaluated. Since the Cramer classification system is based on the oral route of administration, therefore it may not be relevant for assigning inhalation-based toxicity. The tentatively assigned structures are presented in Figure 5, structures 1-14 showing the species with phenylacetate function, and Figure 5, structures 15-29 showing degradation species without the phenyl-acetate function. The author has no intention to estimate or evaluate the toxicity of the individual degradation products.
Based on the tentatively assigned structures the following degradation products were classified as:
Cramer class I: 1, 2, 4, 15, 16, 17, 19, 20, 22, 24 (10 out of 29).
Cramer class II: 3, 5, 25, 26 (4 out of 29).
Cramer class III: 6, 7, 8, 9, 10, 11, 12, 13, 14, 18, 21, 23, 27, 28, 29 (15 out of 29).
Upon observation, the majority of the degradation products (51.7%) were classified as Cramer class III and it would be wise to further evaluate the potential toxicity of those degradation species.
The levels of the thermal degeneration products were also estimated and presented in Tables 1 and Table 2.
Based on the tentatively assigned chemical structures, the logP of the analytes can be calculated [52]. Based on the logP value for the individual degradation product, the solubility in the alveolar lining fluid can be estimated. Lower logP values will indicate better solubility, therefore, better absorption by the respiratory tract [53]. The logP of VEA itself is relatively high (logP=12.26), indicating very low absorption by the polar environment of a healthy alveolus. However, during the thermal degradation process, polar species are formed either by the creation of a double bond on the hydrocarbon chain (structure No. 16 and 22) or oxidation which will reduce the logP value. For example, the log P of structure No. 16-hydrocarbon with a double bond has a logP=6.5, structure No. 15 has a logP=1.35, structure No. 4 has logP=2.28. The reduced logP values may predict that the more polar degradation products have better absorption into the alveolar lining fluid and therefore have a higher chemical impact than the VEA itself.
The data in the tables show that only 4 degradation products (component No. 3, 6, 19, and 27) were detected at 170°C temperature, and the overall estimated exposure level is estimated at 215 µg/day. Even at 190°C, the total exposure is below 540 µg/day. At the highest temperature, the exposure level is above 134 mg/day. Although component No. 4 shows the highest level as individual degradation products, the sum of the degradation products associated with a phenyl-acetate function is approximately half of the degradation products without the phenyl-acetate group. It also appears that the degradation group with phenyl-acetate function shows a higher number of Cramer class III products compared to the other group.
3.1. Benefit of using High Resolution Accurate Mass Detection
High-Resolution Accurate Mass (HRAM) based detection hyphenated with gas-chromatography has been used for decades in the analytical laboratories, However, in the past were only sector-type instruments available. Those instruments were required significant laboratory space and significant capital investment compared to the benchtop systems. Therefore, they were not a very popular choice for the laboratories. The landscape has been changed when a benchtop Q-Tof or Orbitrap-based instrumentations were commercially introduced in the early 2000’s. The major advantage of an HRAM based detection is the accurate mass-based elemental composition of the spectral peak and the reduced level of background (spectral) noise.
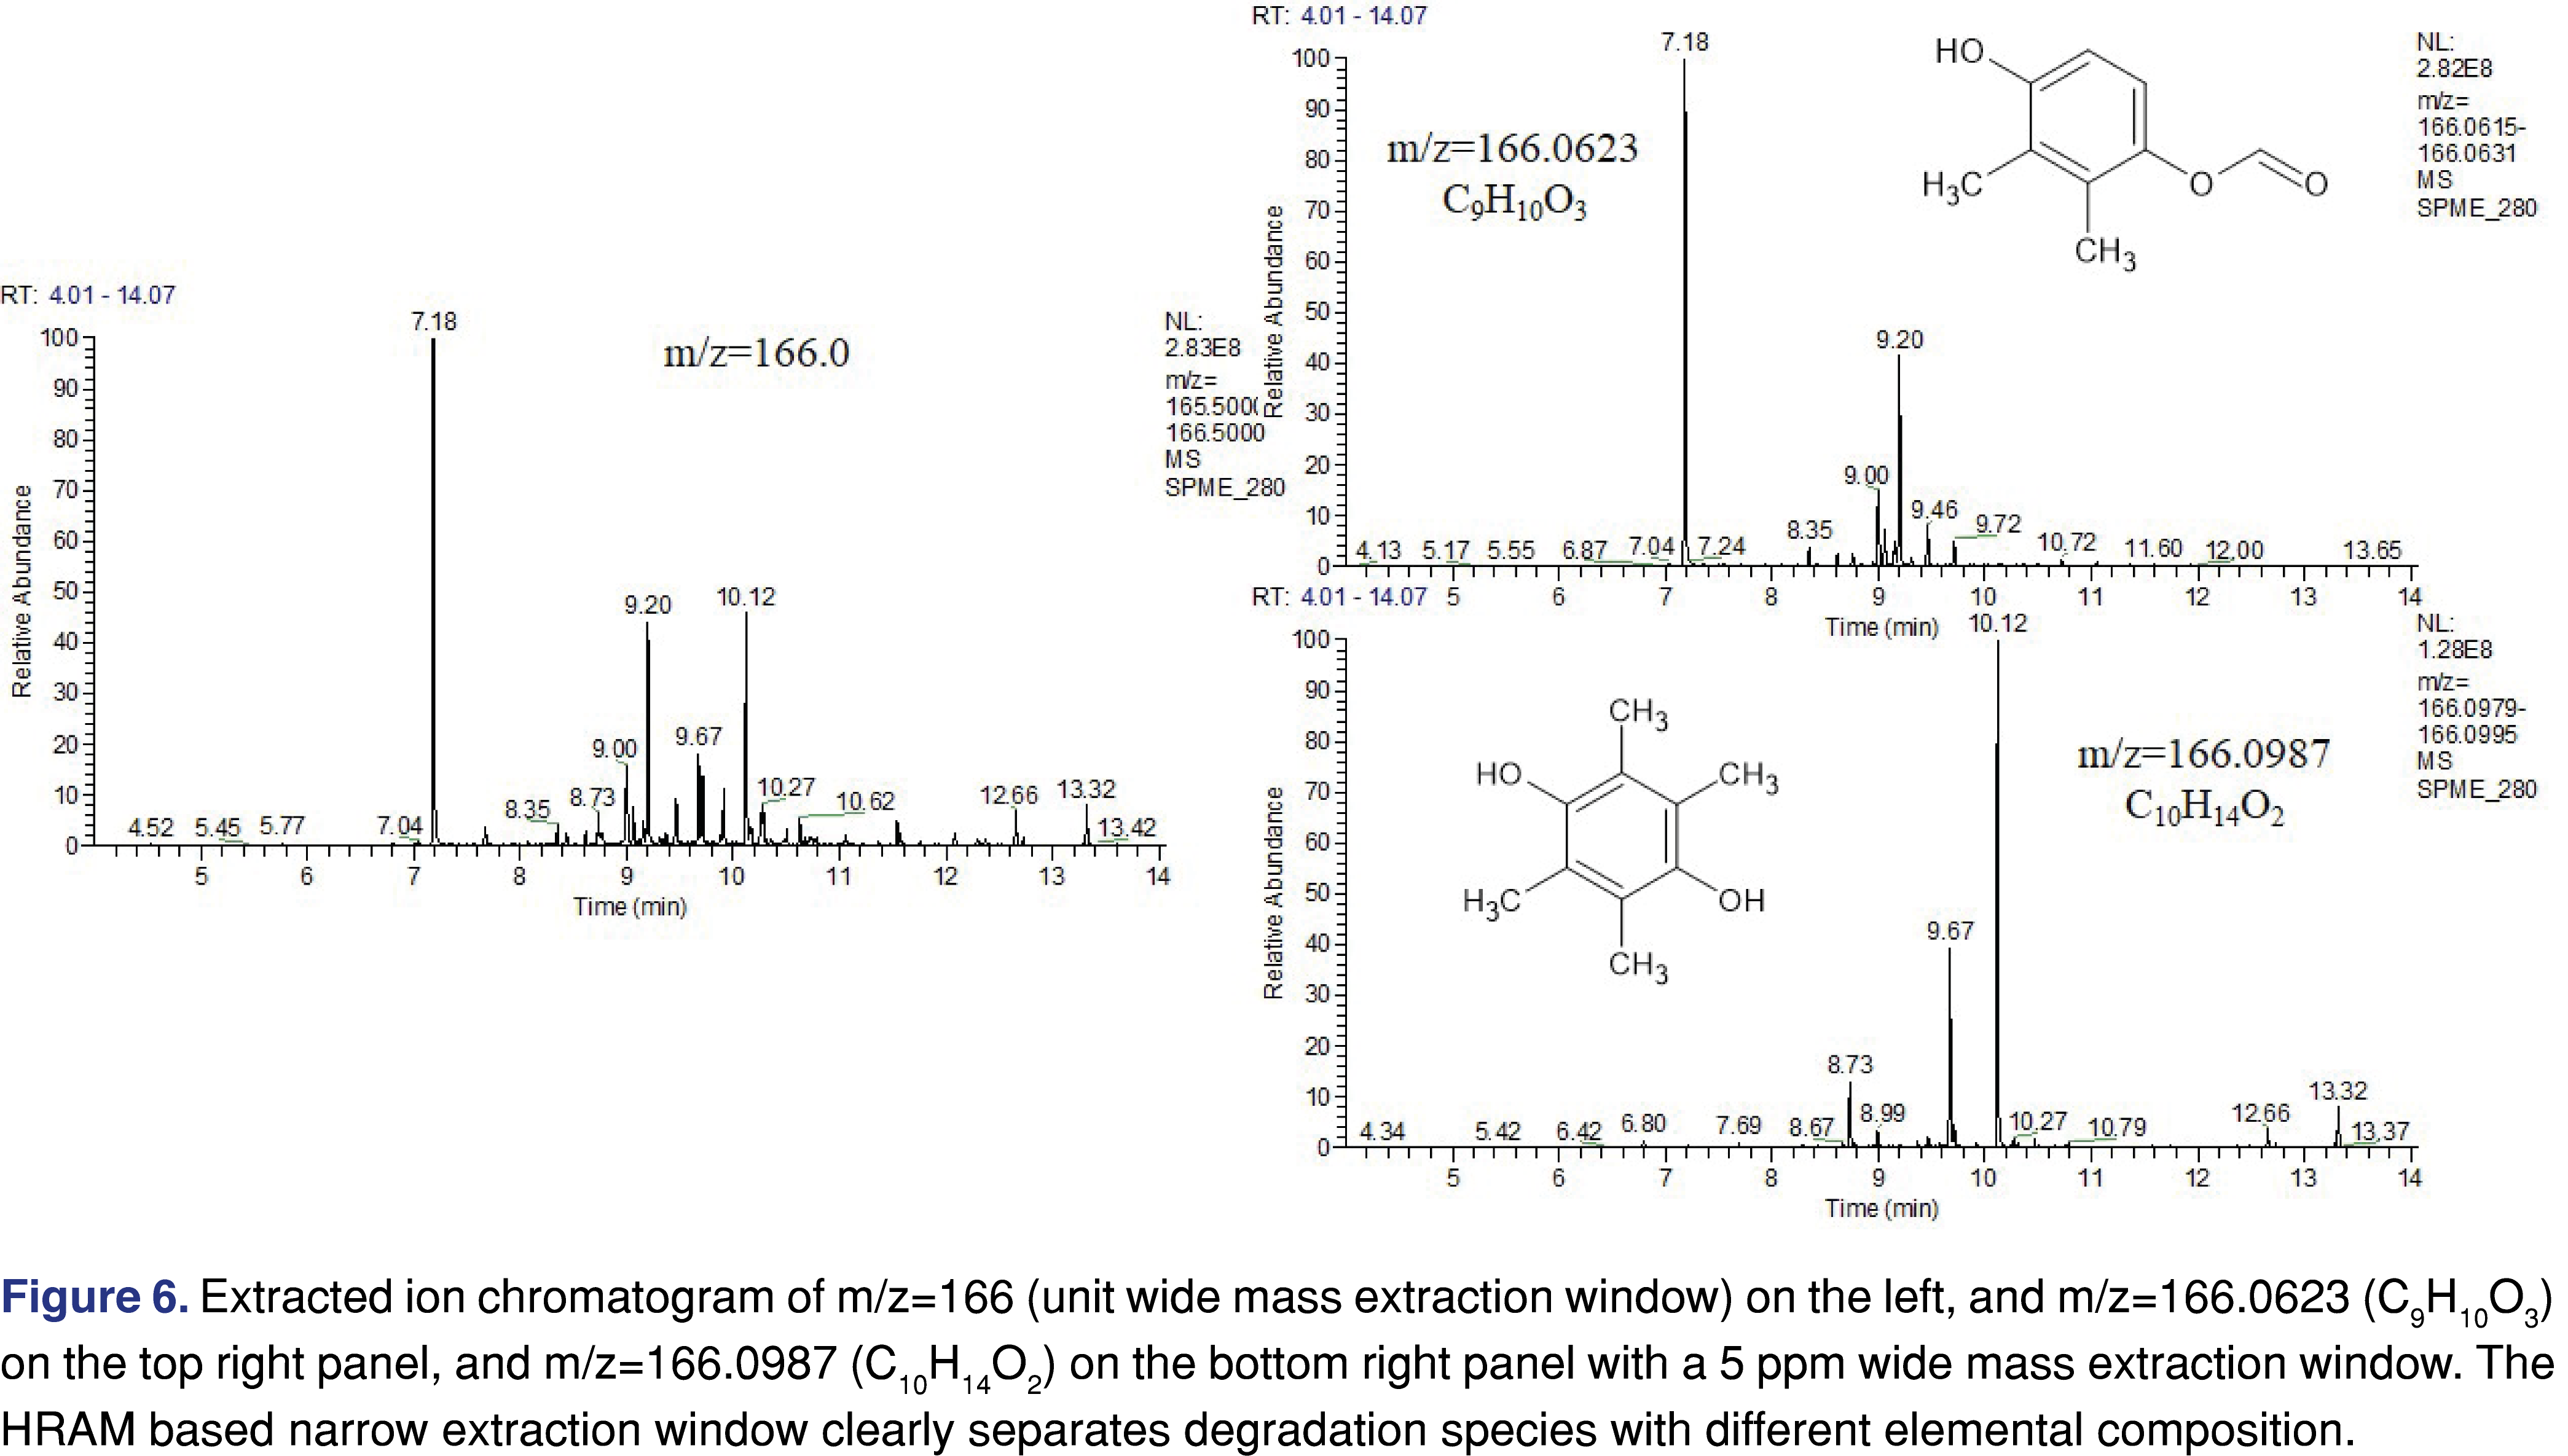
The data in Tables 1 and Table 2 shows multiple degradation species with the same nominal mass (m/z=192 for 5 and 26; m/z=290 for 8 and 9; m/z=166 for 19 and 20, and m/z=204 for 27 and 28 pairs), however, the accurate mass results are different for the last 3 sets and their elemental composition is different. For example, the m/z=166.0987 is associated with the elemental composition of C10H14O2, while the m/z=166.0623 is associated with C9H10O3. The scenario for the difference between the extracted ion chromatograms of unit resolution and the high resolution was presented in Figure 6.
The chromatograms of Figure 6 show significant differences when a unit resolution mass extraction window is being used. Approximately 15 peaks can be observed in the chromatogram. Since they are associated with the same nominal mass, it is believed they are related to each other. However, when a 5 ppm wide mass extraction window is being used, the species with the same elemental composition were shown in one chromatogram and became clear that species are related to each other within the same elemental group. It helps to differentiate different chemical species in addition to the fragmentation pattern.
3.2. Impact of the Sample Preparation for the Identification Process
Sample preparation is playing an important role in the analysis of complex mixtures [54]. Reliable and optimized sample preparation may:
reduce interferences from the sample matrix
enhance the concentration of the analyte(s) of interest
• reduce the cost of the analysis
• reduce the overall time of the sample analysis
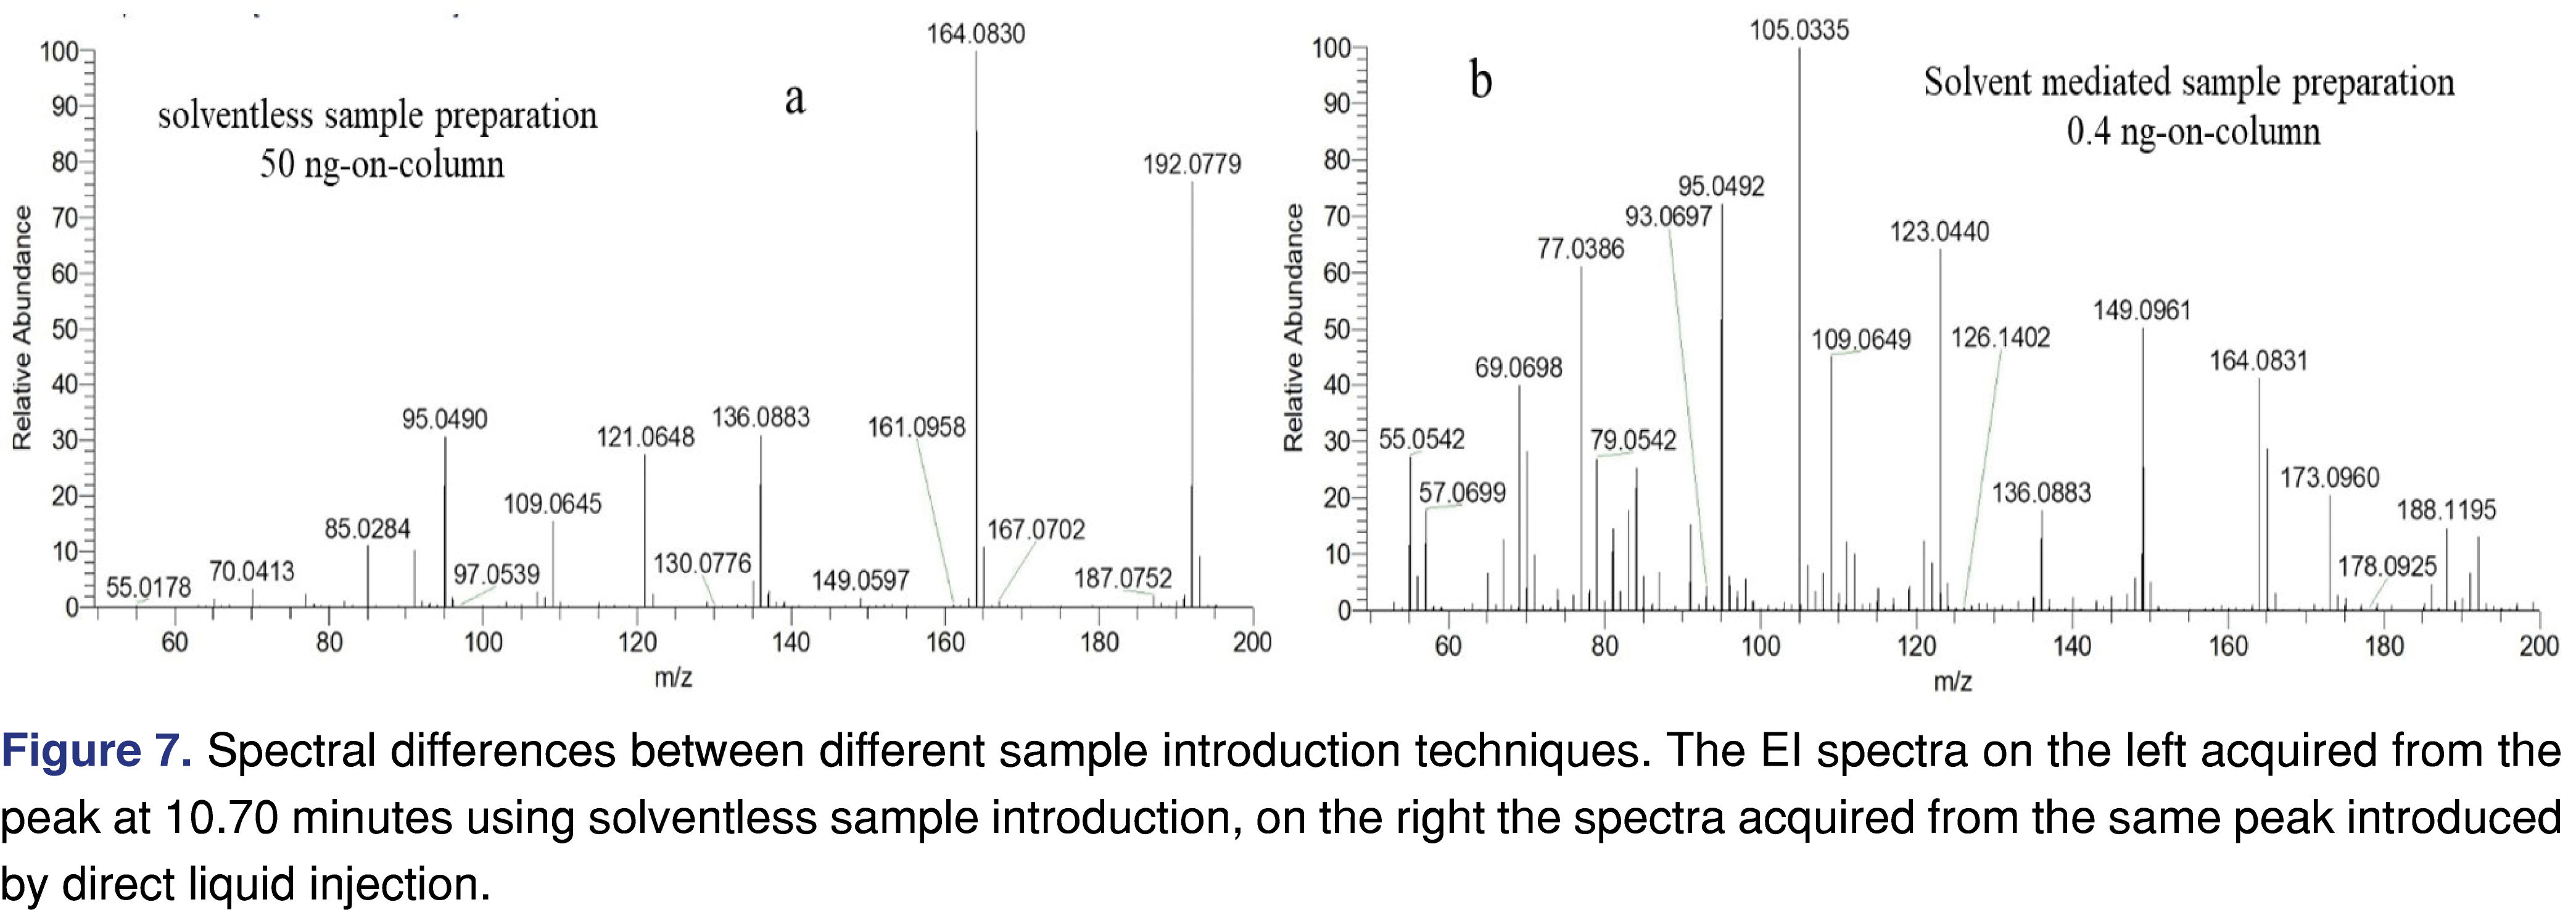
Headspace-based SPME sample preparation was used as sample preparation and sample introduction for GC-MS, since the focus of the study was to evaluate the volatile degradation species, assuming they will reach the lung and may be connected to the EVALI epidemic. SPME seemed a reasonable fit for purpose as only the most volatile and semi-volatile species reach the fiber during the sampling and the heavy matrix of non-volatiles are not reaching the fiber and therefore they are not extracted. The sampling technique is also known for concentrating the analyte in the head-space. Thus, it enhances a chance for higher amounts of analytes introduced to the GC-MS, which increases the quality of the spectral data. The SPME sample preparation was compared to the direct injection of a degradation sample is presented in Figure 7. The thermal degradation sample was dissolved in dichloromethane and was injected directly into the GC-MS system. With SPME extraction, approximately 50 ng of a selected analyte was introduced to the system and detected and with direct liquid injection, only 0.4 ng of the same analyte was introduced and detected. The major reason for this considerable difference is that SPME concentrates the analytes, in contrast when the thermally degraded sample dissolved in a solvent it is diluted and only a small portion of the diluted material is injected and reaches the column. The result of the lower amount of analyte shows a significant difference in the spectral quality. The EI spectra on the left show negligible effect of the column bleed associated peaks, however, when the amount of the analyte is low, the background peaks become significant, reducing the spectral quality. As the spectral quality lowers with the direct liquid introduction, the identification becomes difficult, as the analyst needs to spend time and effort to assign which peak is related to the target analyte and which peak is related to the background.
4.0. Conclusion
High-Resolution GC-MS combined with SPME sample preparation was used to evaluate and identify VEA thermal degradation products. The performed thermal degradation experiment resulted in over a hundred volatile degradation species. Although the maximum degradation temperature was lower than the pyrolysis temperature, which is usually associated with the electronic vaping devices, the formation of potential ketene precursor species previously reported [2], were also observed in our study. Based on the acquired data, the vitamin E acetate thermal degradation species are more polar and associated with lower logP than the original molecule, and likely to have better absorption to the alveolus lining fluid. The solventless sample preparation technique showed some benefit over the traditional “dissolve and shoot” approach, resulting in higher quality spectra data for identification and quantitation purposes. The toxicity of the identified species has not been evaluated, however, the presented data in this paper can support further toxicological risk assessment, related to vaping products, that are containing VEA .
5.0 Acknowledgment
The author would like to express his gratitude to Intertek Pharmaceutical Services for the opportunity to have access to a high-resolution accurate mass GC-MS system.
6.0 References
- Outbreak of Lung Injury Associated with the Use of E-Cigarette, or Vaping, Products. Available at severe-lung-disease.html
- Dan Wu, and Donal F. O’Sheaa, Potential for release of pulmonary toxic ketene from vaping pyrolysis of vitamin E acetate. PNAS 117(12), 6349–6355 (2020). https://doi.org/10.1073/pnas.1920925117
- Krauß S, Darwisch V, Vetter W. Occurrence of tocopheryl fatty acid esters in vegetables and their nondigestibility by artificial digestion juices, Sci Rep 8, 7657 (2018). https://doi.org/10.1038/s41598-018-25997-2
- Sun LH. Contaminant found in marijuana vaping products linked to deadly lung illnesses, tests show. The Washington Post, September 6 (2019). https://www.washingtonpost.com/health/2019/09/05/contaminant-found-vaping-products-linked-deadly-lung-illnesses-state-federal-labs-show/
- Lanzarotta A, Falconer TM, Flurer R, Wilson RA. Hydrogen Bonding between Tetrahydrocannabinol and Vitamin E Acetate in Unvaped, Aerosolized, and Condensed Aerosol e Liquids. Anal Chem 92, 2374-2378 (2020). https://doi.org/10.1021/acs.analchem.9b05536
- https://casaa.org/education/vaping/historical-timeline-of-electronic-cigarettes/
- A report of the Surgeon General; E-Cigarette Use Among Youth and Young Adults. Available at https://www.cdc.gov/tobacco/data_statistics/sgr/e-cigarettes/pdfs/2016_SGR_Chap_1_508.pdf
- https://www.drugsandalcohol.ie/33211/1/Use-of-e-cigarettes-vapes-among-adults-in-Great-Britain-2020.pdf
- Chung SS, Zheng J, Kwong A, Lai V. Report on e-cigarettes analytical testing Honkong Council on smoking and health (2016).
- Goniewicz ML et al. Levels of selected carcinogens and toxicants in vapour from electronic cigarettes. Tob Control 23(2), 133–139 (2014). https://doi.org/10.1136/tobaccocontrol-2012-050859
- Peace M, Poklis J, Turner J. Chasing The Electronic Dragon: Characterizing the Evolution and Impact of Design and Content. National Institute of Justice Research and Development in Forensic Science for Criminal Justice, Final Report Grant Number: 2016-DN-BX-0150, (2018). Available at https://www.ojp.gov/pdffiles1/nij/grants/252921.pdf
- Krakowiak RI, Poklis JL, Peace MR. The Analysis of Aerosolized Methamphetamine From E-cigarettes Using High Resolution Mass Spectrometry and Gas Chromatography Mass Spectrometry. J Anal Toxicol 43, 592–599 (2019). https://doi.org/10.1093/jat/bkz067
- https://www.fda.gov/news-events/press-announcements/fda-commits-evidence-based-actions-aimed-saving-lives-and-preventing-future-generations-smokers
- https://www.cdc.gov/tobacco/basic_information/e-cigarettes/Quick-Facts-on-the-Risks-of-E-cigarettes-for-Kids-Teens-and-Young-Adults.html
- https://ash.org.uk/wp-content/uploads/2021/07/Use-of-e-cigarettes-among-young-people-in-Great-Britain-2021.pdf
- Boudi F et al. Vitamin E Acetate as a Plausible Cause of Acute Vaping-related Illness. Cureus 11(12): e6350 (2019). https://doi.org/10.7759/cureus.6350
- Blazsó M et al. Thermo-oxidative degradation of aromatic flavour compounds under simulated tobacco heating product condition. J Anal Appl Pyrol 134, 405–414 (2018). https://doi.org/10.1016/j.jaap.2018.07.007
- Insights for aerosol analysis in cannabis products. Restek Corporation Webinar, 20-May-2021 (2021).
- Vas G. Analytical challenges and solutions for testing e-cigarettes. How to deal with special gas based extraction methods for product evaluation, Regulations for e-cigarette symposium 2016, 5-7 December, 2016, Alexandria VA (2016).
- Schaller JP et al. Evaluation of the Tobacco Heating System 2.2. Part 2: Chemical composition, genotoxicity, cytotoxicity, and physical properties of the aerosol. Reg Toxicol Pharmacol 81, S27eS47 (2016). https://doi.org/10.1016/j.yrtph.2016.10.001
- Tayyarah R, Long GA. Comparison of select analytes in aerosol from e-cigarettes with smoke from conventional cigarettes and with ambient air. Reg Toxicol Pharmacol 70, 704–710 (2014). https://doi.org/10.1016/j.yrtph.2014.10.010
- Elliott DR et al. Giant cell interstitial pneumonia secondary to cobalt exposure from e-cigarette use. Eur Respir J 54, 1901922 (2019). https://doi.org/10.1183/13993003.01922-2019
- Layden JE et al. Pulmonary illness related to e-cigarette use in Illinois and Wisconsin – preliminary report. N Engl J Med (2019).
- CDC clinician outreach and communication activity. (2019).
- Triantafyllou GA et al.: Vaping-associated acute lung injury: a case series. Am J Respir Crit Care Med 200, 1430-1431 (2019). https://doi.org/10.1164/rccm.201909-1809LE
- Blount BC et al. for the Lung Injury Response Laboratory Working Group* Vitamin E Acetate in Bronchoalveolar-Lavage Fluid Associated with EVALI, New Engl J Med 382(8) (2020).
- National Institute for Occupational Safety and Health (NIOSH), Ketene. Avaliable at https://www.cdc.gov/niosh/idlh/463514.html.
- https://chem.libretexts.org/Bookshelves/Physical_and_Theoretical_Chemistry_Textbook_Maps/Supplemental_Modules_(Physical_and_Theoretical_Chemistry)/Kinetics/06%3A_Modeling_Reaction_Kinetics/6.02%3A_Temperature_Dependence_of_Reaction_Rates/6.2.03%3A_The_Arrhenius_Law/6.2.3.01%3A_Arrhenius_Equation
- Gasparyan H, Mariner D, Wright C, Nicol J, Murphy J, Liu C, Proctor C. Accurate measurement of main aerosol constituents from heated tobacco products (HTPs): Implications for a fundamentally different aerosol. Reg Toxicol Pharmacol 99, 131–141 (2018). https://doi.org/10.1016/j.yrtph.2018.09.016
- https://vaping360.com/learn/optimal-temperature-to-vape-weed/
- Chen W, Wang P, Ito K, Fowles J, Shusterman D, Jaques PA, Kumagai K. Measurement of heating coil temperature for e-cigarettes with a “top-coil” clearomizer, PLOS ONE 13(4), e0195925 (2018). https://doi.org/10.1371/journal.pone.0195925
- USP General Chapter 41. Balances.
- Vas G, Vekey K. Solid-phase microextraction: a powerful sample preparation tool prior to mass spectrometric analysis. J Mass Spectrom 39, 233–254 (2004). https://doi.org/10.1002/jms.606
- Nick Snow Introduction to Capillary GC Injection Techniques. Available online: https://chem.libretexts.org/Bookshelves/Analytical_Chemistry/Supplemental_Modules_(Analytical_Chemistry)/Chromedia/01Gas_Chromotography_(GC)/Gas_Chromotography%3A_In_Practice/02Gas_Chromatography%3A_Injection_techniques_and_principles/07Introduction_to_Capillary_GC_injection_techniques.
- Vas G, Fleck L, Comstock K, Cole J. Extractable and Leachable Testing for Pharmaceutical Packaging, Finished Pharmaceutical Products, and Medical Devices: An Analytical Perspective. Curr Trends Mass Spectrom , 5-14 (2020).
- Vas G, Fleck L, Michelson A, Dunn N, Duett J, Cali J.Importance of a High Performing GC-MS Based Screening Method for Testing Stability Samples for Volatile and Semi- Volatile Leachable Impurities. Rev Sep Sci 3(1), 3-20 (2021). https://doi.org/10.17145/rss.21.002
- Gerstel Inc. Sample Introduction Techniques for Capillary Gas Chromatography, version 3.0 11/1998.
- EFSA Scientic Committee. Guidance on the use of the Threshold of Toxicological Concern approach in food safety assessment. EJ EFSA Journal (2020).
- Carthew P, Clapp C, Gutsell S. Exposure based waiving: the application of the toxicological threshold of concern (TTC) to inhalation exposure for aerosol ingredients in consumer products Food Chem Toxicol 47(6), 1287-1295 (2009). https://doi.org/10.1016/j.fct.2009.02.024
- https://www.cfsanappsexternal.fda.gov/scripts/fdcc/index.cfm?set=FoodSubstances&id=TOCOPHEROLACETATE
- Safety Assessment of Tocopherols and Tocotrienols as Used in Cosmetics, Final Amended Report, April 14, (2014). Available at http://www.cir-safety.org/sites/default/files/tocoph032014FR.pdf
- https://ecigone.com/e-cigarette-basics/how-much-vape-juice-daily/
- Nakata H, Tatematsu A. Mechanism of mass spectral ketene elimination from phenyl acetates. Org Mass Spectr 5, 1343-1344 (1971). https://doi.org/10.1002/oms.1210051112
- Lopez-Avila V, Yefchak G. Mass Spectral Fragmentation Studies of Coumarin-Type Compounds Using GC High-Resolution MS. The Open Analytical Chemistry Journal 5, (2011). https://doi.org/10.2174/187406500115010027
- Thermo Fisher Scientific, Customer Application Note 73327, Thermal decomposition of vitamin E acetate in a surrogate vaping environment (2020).
- Kühnle M et al. Online Coupling of Gas Chromatography to Nuclear Magnetic Resonance Spectroscopy: Method for the Analysis of Volatile Stereoisomers. Anal Chem 80(14), 5481–5486 (2008). https://doi.org/10.1021/ac8004023
- Cramer GM, Ford RA, Hall RL. Estimation of toxic hazard – Decision tree approach. Food Cosmet Tox 16, 255–276 (1978). https://doi.org/10.1016/S0015-6264(76)80522-6
- Munro IC, Ford RA, Kennepohl E, Sprenger JG. Correlation of structural class with no-observed-effect levels: a proposal for establishing a threshold of concern. Food Chem Toxicol 34, 829–867 (1996). https://doi.org/10.1016/S0278-6915(96)00049-X
- Reilly L at al. Testing the thresholds of toxicological concern values using a new database for food-related substances. Toxicology Letters 314, 117–123 (2019). https://doi.org/10.1016/j.toxlet.2019.07.019
- Idea Consult Toxtree (Estimation of Toxic Hazard – A Decision Tree Approach), version 3.1.0-1851-1525442531402. Available at http://toxtree.sourceforge.net/
- US EPA. Estimation Programs Interface Suite™ for Microsoft® Windows, v 4.1. United States Environmental Protection Agency, Washington, DC, USA. Aavailable at https://www.epa.gov/tsca-screening-tools/epi-suitetm-estimation-program-interface (2011).
- ToxTutor. Available at http://www.toxmsdt.com/103-respiratory-tract.html
- Vas G. State of the art solventless sample preparation alternatives for analytical evaluation of the volatile constituents of different cannabis based products. Eds: Imma Ferrer and E. Michael Thurman, Chapter 4. Comprehensive Analytical Chemistry; Analysis of Cannabis Elsevier, ISBN: 978-0-444-64341-4 (2020).
All site content, except where otherwise noted, is licensed under a Creative Commons Attribution 4.0 License