OPEN-ACCESS PEER-REVIEWED
RESEARCH ARTICLE
Mark J. Perkins1, Vaughan S. Langford2,*
1Anatune Limited, Wellbrook Court, Girton Road, Cambridge, CB3 0NA, UK; 2Syft Technologies Limited, 68 Saint Asaph Street, Christchurch 8011, New Zealand.
Reviews in Separation Sciences. Vol.4. No.1. pages e22001 (2022).
Published online 23 January 2022. https://doi.org/10.17145/rss.22.001 | (ISSN 2589-1677).
- Abstract
- Keywords
- 1.0. Introduction
- 2.0 Experimental
- 2.1. Materials and Reagents
- 2.2. Instrumentation
- 2.3. Method Development
- 3.0. Results
- 4.0. Discussion
- 4.1. Optimized MHE Conditions
- 4.2. Sequence Schedule Optimization for Routine Analysis
- Figures and Tables
- 4.3. Increased throughput via correlation of MHE with static HS
- 4.4. MHE-SIFT-MS: Scope of Application
- 4.5. Recommended Workflow for Routine Analysis
- 5.0. Conclusion
- 6.0 References
*Correspondence:
Langford VS. . Syft Technologies Limited, 68 Saint Asaph Street, Christchurch 8011, New Zealand.
Editor: Mohammad Sharif Khan, Wake Forest Baptist Health, Winston-Salem NH, USA.
Open-access and Copyright:
©2022 Perkins MJ and Langford VS. This article is an open-access article distributed under the terms of the Creative Commons Attribution License (CC-BY) which permits any use, distribution, and reproduction in any medium, provided the original author(s) and source are credited.
Funding/Manuscript writing assistance:
The authors have declared that no funding and writing assistance was utilized in the production of this article.
Competing interest:
The authors are employed by above-mentioned organizations and have declared that no competing interests exist..
Article history:
Received 06 October 2021, Revised 28 November 2021, Accepted 12 December 2021.
Abstract
The toxicity of many volatile organic compounds (VOCs) means that the safety of polymeric and other materials in contact with, or near, pharmaceutical and food products must be assured through sensitive, quantitative measurement. The multiple headspace extraction (MHE) technique was developed in the 1980s to provide quantitative analysis of VOCs in condensed-phase samples. Selected ion flow tube mass spectrometry (SIFT-MS) is a direct-injection mass spectrometry (DIMS) technique that often significantly reduces the analysis time for routine VOCs in headspace compared to gas chromatography (GC) methods. Using the prototypical polystyrene system, this study represents the first detailed application of MHE to SIFT-MS, describing protocols for method development (including optimization of equilibration temperature and time, plus calibration), data evaluation, and adoption of the technique into routine analysis. MHE-SIFT-MS gives an eight-fold throughput advantage over MHE-GC while being highly repeatable (relative standard deviation, RSD, less than 2%).
Keywords
SIFT-MS, direct-injection mass spectrometry, headspace, multiple headspace extraction, styrene, polystyrene
1.0. Introduction
Residual volatile compounds in polymers used as components in packaging systems (for example, in drug delivery devices) can migrate into pharmaceutical, personal care, or food products, potentially causing increased health risk due to toxicity [1-4]. However, measuring absolute concentrations of residual monomers, solvents, and other impurities in solid matrices has long been recognized as challenging due to the difficulties involved in homogeneously mixing volatile organic compounds (VOCs) into solid matrices, which precludes determination of headspace (HS) partitioning coefficients [5]. For this reason, Kolb and co-workers developed the multiple headspace extraction (MHE) technique, which is described in practical [5] and theoretical [6] terms, as well as in a more recent monograph [7].
Briefly, as the name for MHE implies, MHE involves repeated sampling of a given sample’s HS. This approach parallels dynamic HS (DHS) analysis in that it aims to determine the complete residual VOC concentration in the solid matrix, but with sequential HS sampling rather than by trapping volatiles on a sorbent or by using continuous analysis. In MHE, equilibrium must be established in the HS prior to sampling into the analytical instrument, then vented or purged prior to the HS being re-equilibrated for the next sampling cycle. Typically, six headspace generation steps are utilized in method development and under equilibrium conditions, an exponential decay in measured concentration is obtained. Kolb and Ettre [6] show that the area under the semi-logarithmic plot of concentration against injection number gives the concentration of VOC in the condensed phase. A linear regression coefficient very close to unity indicates that equilibrium has been achieved and that routine analysis can use fewer HS generation cycles (with all other parameters being kept the same) – typically two to four cycles [5].
There is, however, a significant throughput issue for MHE analysis: sampling a single sample’s HS repeatedly results in very time-consuming and therefore expensive analysis – especially when using gas chromatography (GC)-based approaches [5,8] for which the duration of chromatographic separation can be similar to the headspace equilibration time. Since the pioneering work of Kolb and co-workers, more rapid analytical methods have begun to be adopted for routine analysis. Of particular relevance here are direct-injection mass spectrometry (DIMS) methods, which eliminate the slow chromatographic separation component of the analysis while providing selectivity through combining soft chemical ionization (CI) with mass spectrometric detection. Leading DIMS techniques for VOC analysis are proton transfer reaction-mass spectrometry (PTR-MS) and selected ion flow tube-mass spectrometry (SIFT-MS) [9] although SIFT-MS has been applied more widely to routine analysis [10,11]. DIMS techniques, with their direct, rapid sample analysis, offer opportunities to increase sample throughput when integrated with autosamplers that provide fully optimized sample scheduling. However, in contrast to the pressure-balanced HS autosamplers utilized in GC studies [5,8], DIMS systems are best integrated with syringe-injection autosamplers since slow, steady sample introduction is more compatible with continuous sample ionization than is rapid sample injection optimized for chromatographic peak separation [12].
In this study – the first of a two-part evaluation – a detailed investigation of SIFT-MS analysis coupled with MHE is conducted using a prototypical polymeric system: polystyrene (PS) [5,6]. With this system, method development and optimization procedures for MHE-SIFT-MS are thoroughly investigated. These procedures include highly efficient HS equilibration determination, HS purge-time determination (since the venting possible with pressure-balanced HS injection is not possible), and a calibration approach for SIFT-MS. The transition from ‘full’ six-cycle MHE to a ‘reduced’ three-cycle MHE, and even correlation of MHE to a single static HS injection, is also evaluated. The second part of this study will explore application to more challenging polymers, polyoxymethylene (POM; with a very low glass transition temperature, Tg) and polybutylene terephthalate (PBT; with its susceptibility to hydrolysis at higher incubation temperatures) [13]. The goal of this two-part study is to provide protocols for MHE-SIFT-MS application in routine analysis and delineate the boundaries of its application.
2.0 Experimental
2.1. Materials and Reagents
Polystyrene (PS) pellets (3 to 5 mm) were sourced from Goodfellow (Cambridge, UK). PS pellet samples were freezer milled (at liquid nitrogen temperature) by Rubber Consultants (Hertford, UK) to a particle size of 250 microns. Headspace vials (20 mL) had 150 mg of freezer-milled polymer added in all cases. The particle size and quantity used per vial are similar to those used in previous MHE studies of PS [5,8].
For optimization of headspace incubation time, one sample was prepared for each of four temperatures spanning the temperature range (80, 100, 120, and 140°C). In the MHE study, six replicates were used for each incubation temperature (80, 90, 100, 110, 120, and 140°C). These temperatures were selected to span the glass transition temperature (Tg) of PS (100°C [13]), though not all were used for all phases of the present study.
Styrene monomer (purity >99%) was obtained from Sigma-Aldrich (Gillingham, UK) and used without further purification.
2.2. Instrumentation
SIFT-MS has been described in detail elsewhere [9,14,15]. Briefly, it is a DIMS technique that uses soft chemical ionization to generate mass-selected reagent ions that via gas-phase ion-molecule reactions can rapidly quantify volatile compounds to parts-per-trillion concentrations [16] (by volume, pptV) direct from air and headspace. Up to eight reagent ions (H3O+, NO+, O2+, O–, OH–, O2–, NO2– and NO3–) obtained from a microwave discharge of moist or dry air [17] are available in commercial SIFT-MS instruments. These reagent ions have multiple reaction mechanisms and are rapidly switchable (using a quadrupole mass filter), providing high selectivity. Conveniently, these ions react very slowly or have no reaction with the bulk components of air, such as N2, O2, Ar, and CO2. Headspace analysis was conducted using a SIFT-MS instrument (Voice200ultra, Syft Technologies, Christchurch, New Zealand) integrated with a syringe-injection autosampler (Multi-Purpose Sampler (MPS) Robotic Pro, GERSTEL, Mülheim an der Ruhr, Germany). Syringe-injection autosamplers are the preferred automation technology for SIFT-MS because they allow sample to be injected slowly and steadily for continuous analysis, in contrast to the rapid injection required by chromatographic techniques. The autosampler was controlled using Maestro software (GERSTEL). This software package also provided sample scheduling functionality, including the PrepAhead feature that enables efficient task sequencing. In this study, each sample was incubated in a six-position agitator (GERSTEL) throughout its six-cycle MHE sequence. Two six-position agitators were used here; via software they formed a virtual 12-position agitator/incubator.
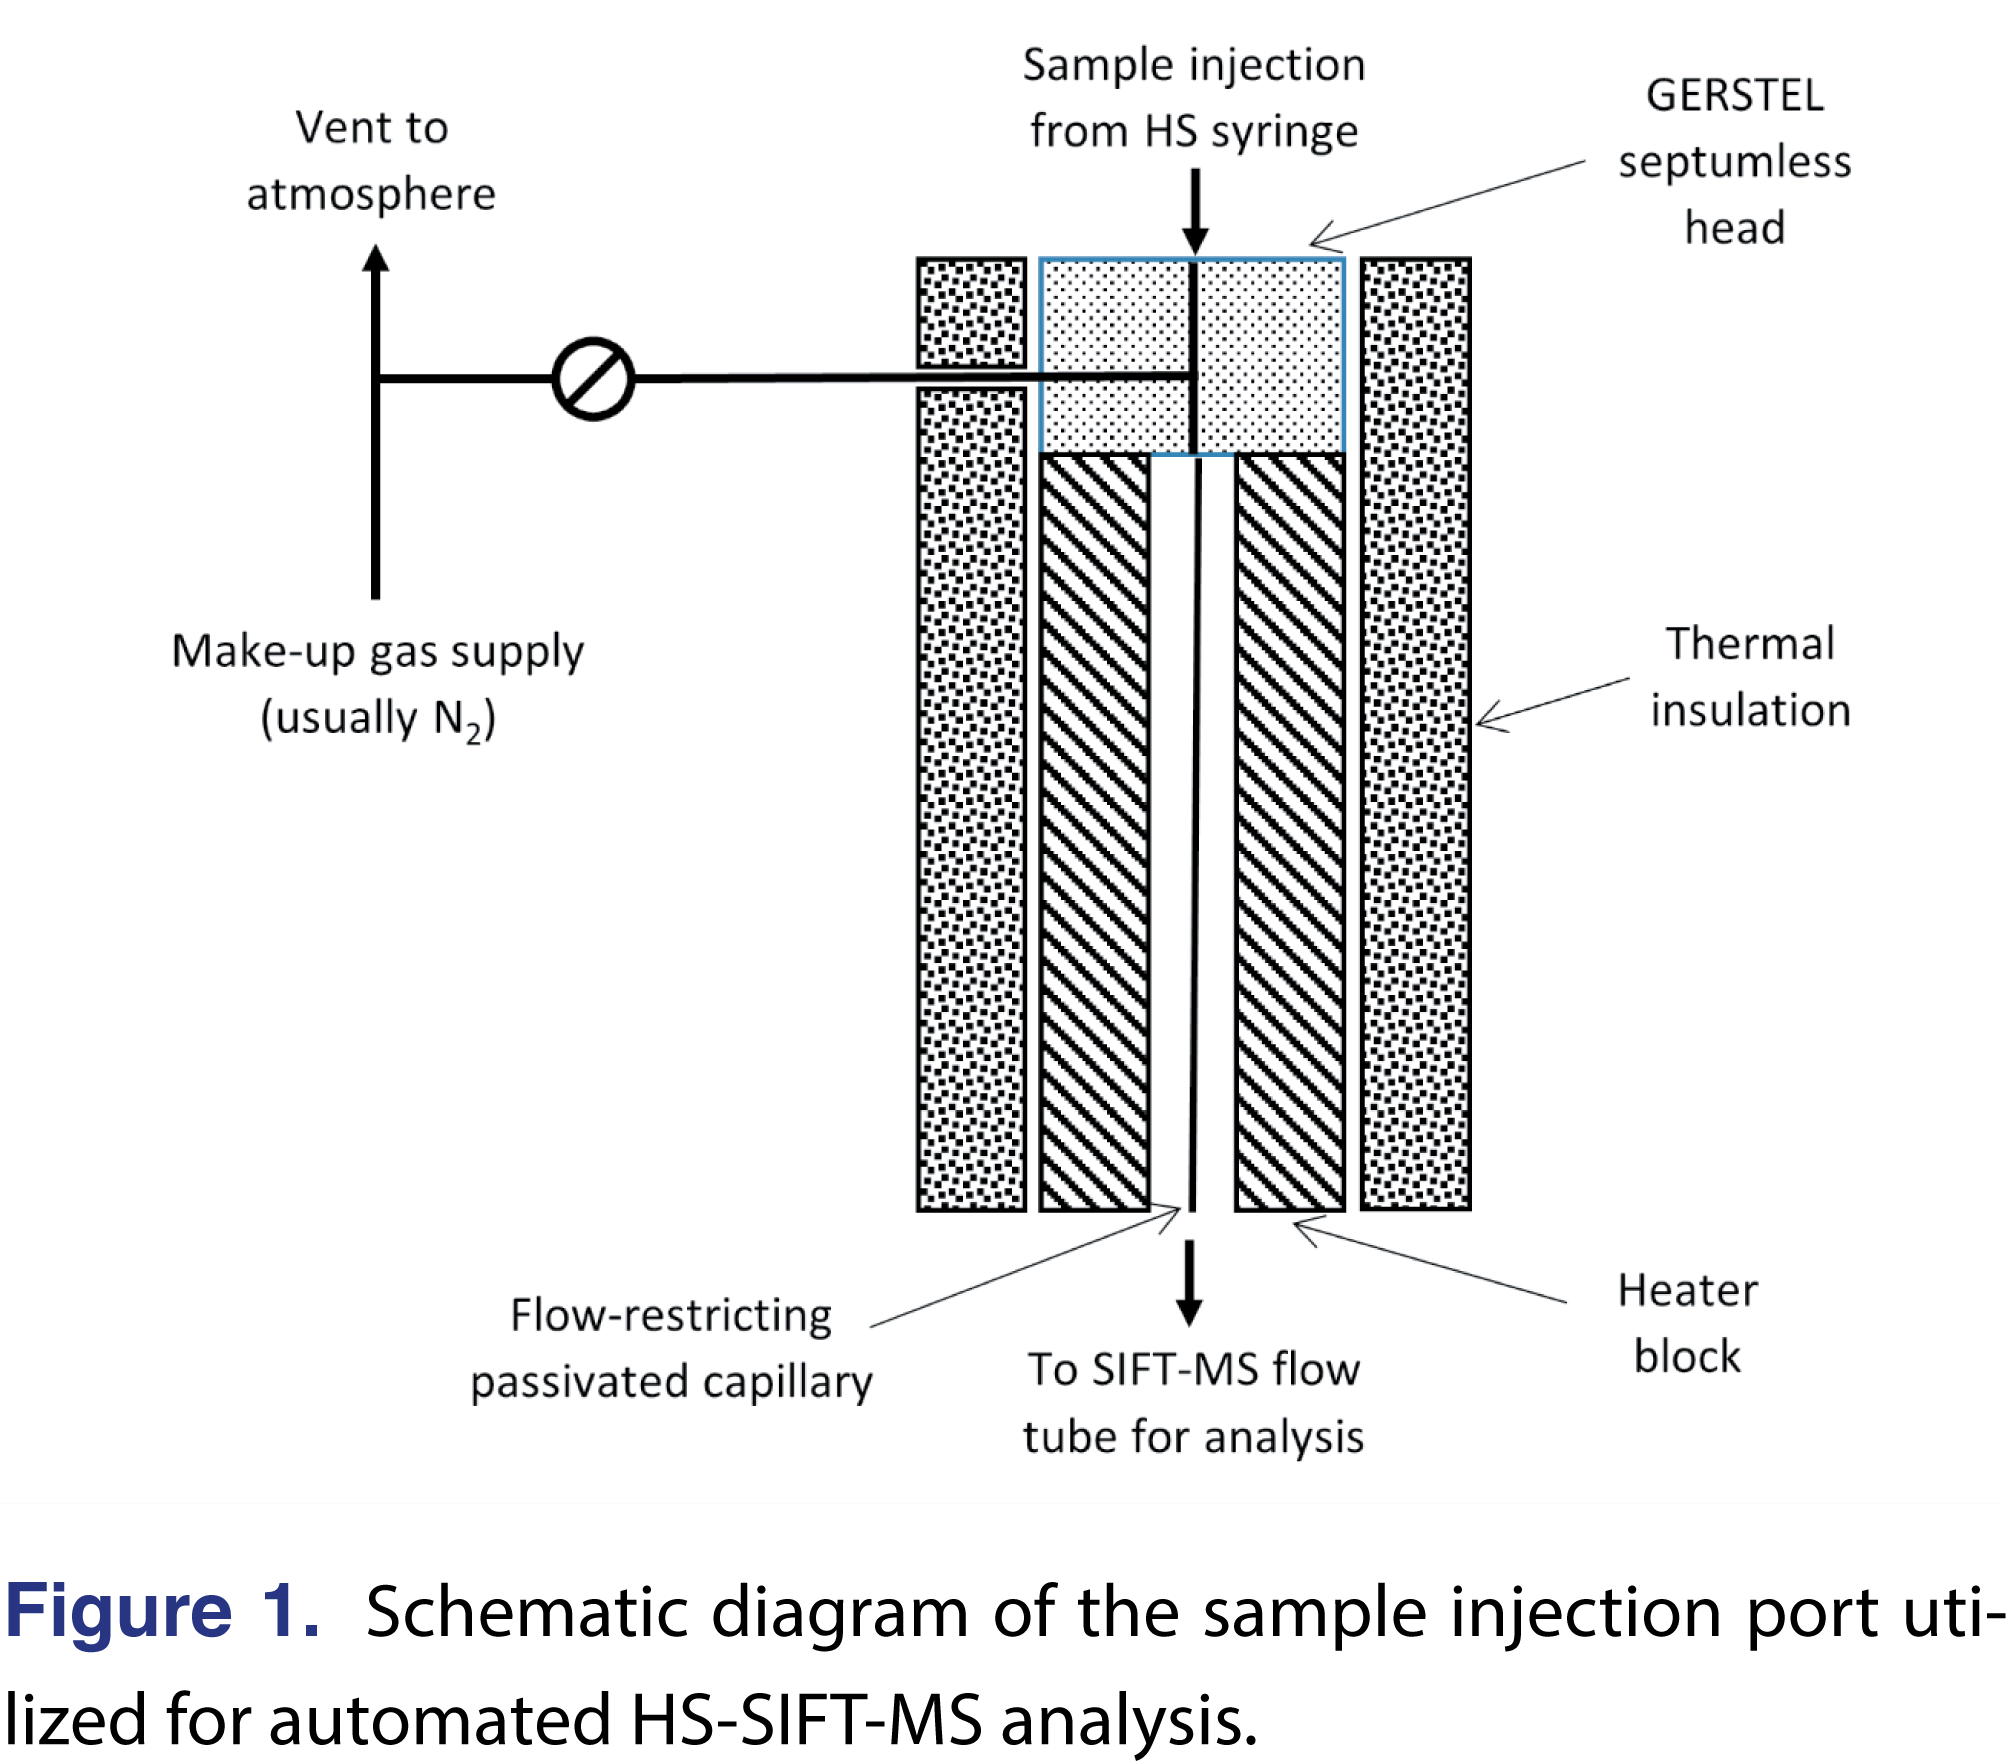
To deliver sample to the SIFT-MS instrument for analysis (Figure 1), the heated inlet (150°C) incorporates a self-sealing septumless head (GERSTEL) through which the needle of the headspace syringe (2.5 mL; heated at 150°C) is injected. In this study, the headspace was injected at a flow rate of 50 µL/s. Since the nominal sample flow into the SIFT-MS instrument is 420 µL/s, a make-up gas flow (ultra-high purity nitrogen) was also introduced through the sampling head. This dilution is accounted for in the concentration calculations, as is the need to account for the loss of some sample from the HS syringe when there is a temperature differential between the headspace and the syringe [18]. The headspace purge required between MHE sampling cycles – required for equilibrium to reestablish –was accomplished using a purge tool (GERSTEL).
In this study, SIFT-MS data were obtained for the styrene residual monomer in selected ion monitoring (SIM) mode. Data were acquired using both the proton transfer product at m/z 95 with the H3O+ reagent ion and the electron transfer product at m/z 94 with NO+ [19]. Concentrations are calculated independently from each product ion. Since these independent measures of concentration agreed very well, an averaged reading is reported here (in part-per-billion by volume, ppbV, in HS). Results for residual content in the polymer are reported in micrograms of residue per gram of polymer (µg/g).
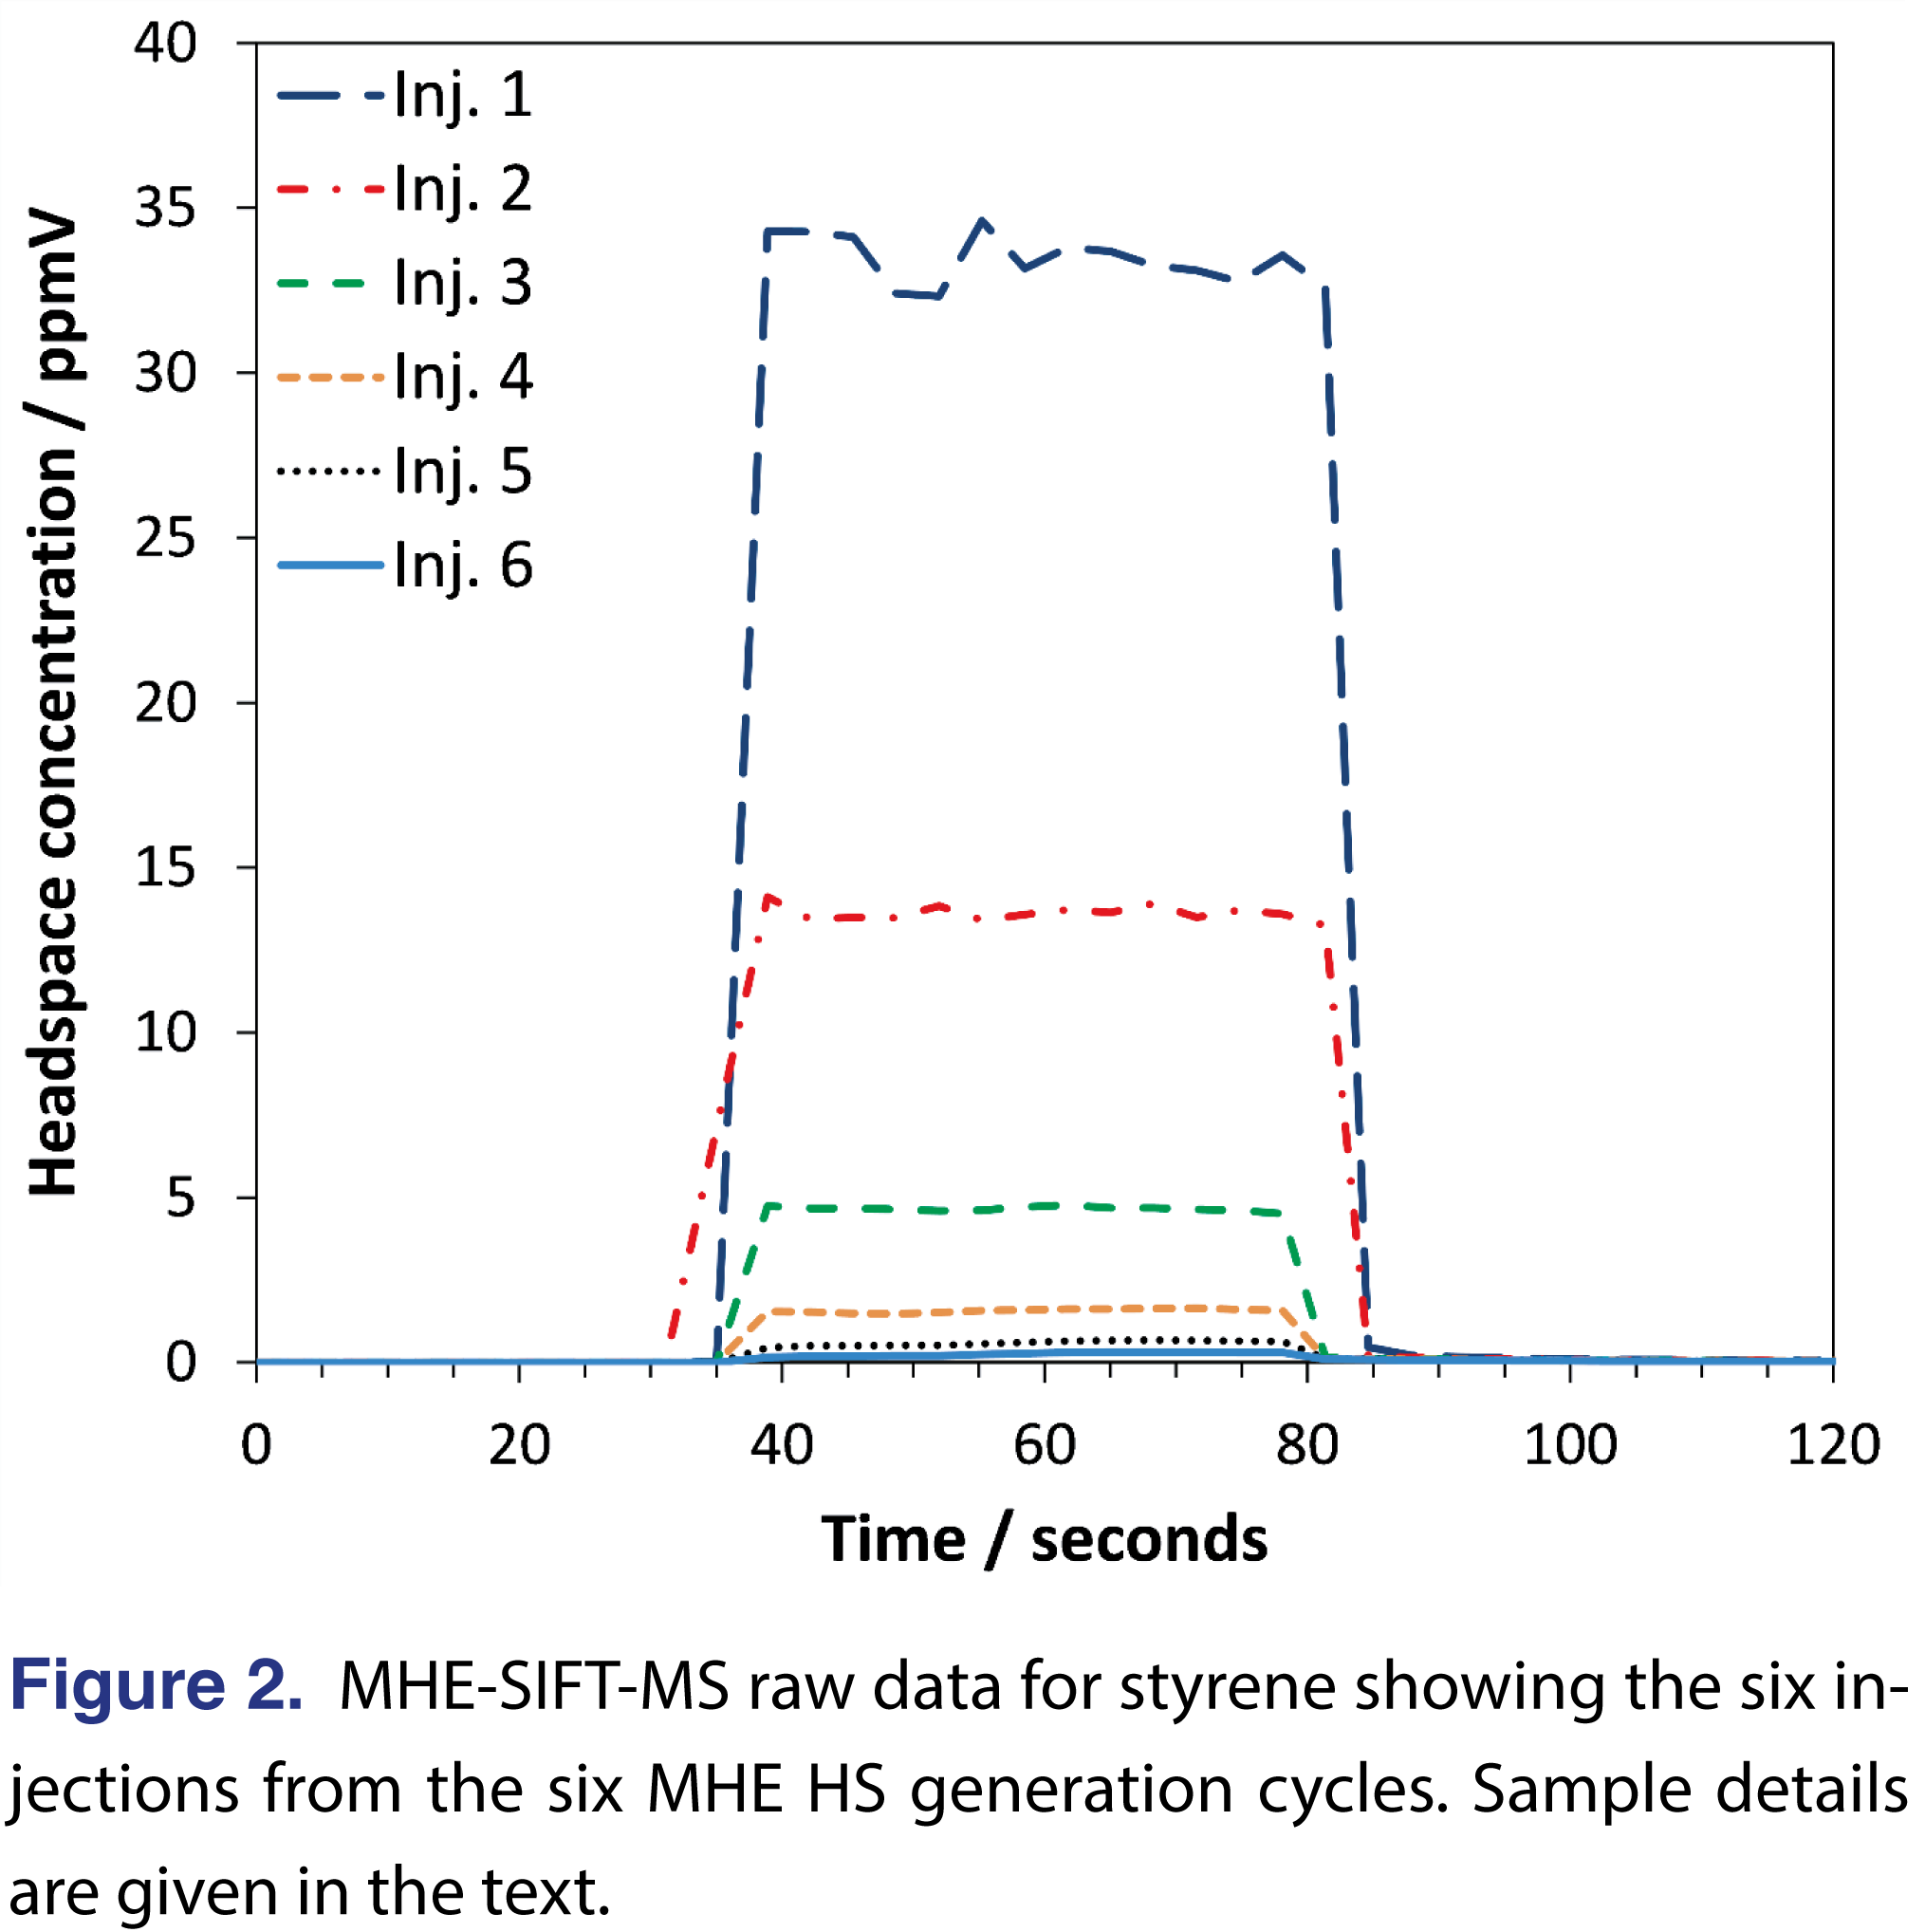
The analysis time for each sample was 120 s. Figure 2 shows the six MHE injections for a single sample (140°C incubation (90 minutes), first replicate). The SIFT-MS instrument has a 200-ms ion dwell time for each data point on this figure. In Figure 2, HS is injected into the instrument between about 40 and 80 s. Instrument blank values can be determined from the baselined values before and/or after injection (where the latter region can also be used to detect carryover in the SIFT-MS instrument; in this case, there is none). Sample blanks were conducted on identical, but empty 20-mL sample vials. When analyzing a single residual monomer, the duration of sample injection used here is far longer than required to achieve acceptable precision. It has been demonstrated previously that the same injection window is suitable for significantly larger compound suites [10,11] and even full-scan analysis with all three positively charged reagent ions [20-22].
2.3. Method Development
In contrast with previous studies that utilized static HS-SIFT-MS [10,23,24], SIFT-MS method development is trivial for residual monomer analysis because it simply targets the residual monomer in a comparatively simple HS matrix. Where possible, as indicated above, multiple product ions are still utilized to assure selective analysis. Furthermore, sample injection rates, etc., can simply be transferred from static HS studies, so are not elaborated here. The focus of this subsection is to describe the approach taken to achieve optimal data quality for MHE-SIFT-MS analysis of polymeric materials. Since parameter optimization for static HS-SIFT-MS is now well understood [10,11], the key parameters are (1) the incubation temperature, (2) the time to achieve equilibrium at a given incubation temperature, and (3) the time to purge the HS prior to the next incubation cycle (a necessary replacement when using a syringe-injection autosampler, compared to the simpler vent for a pressure-balanced autosampler). For PS, incubation temperatures below, at, and above the polymer’s glass transition temperature were utilized to facilitate investigation of the impact of the transition on HS development.
2.3.1. Equilibration Time
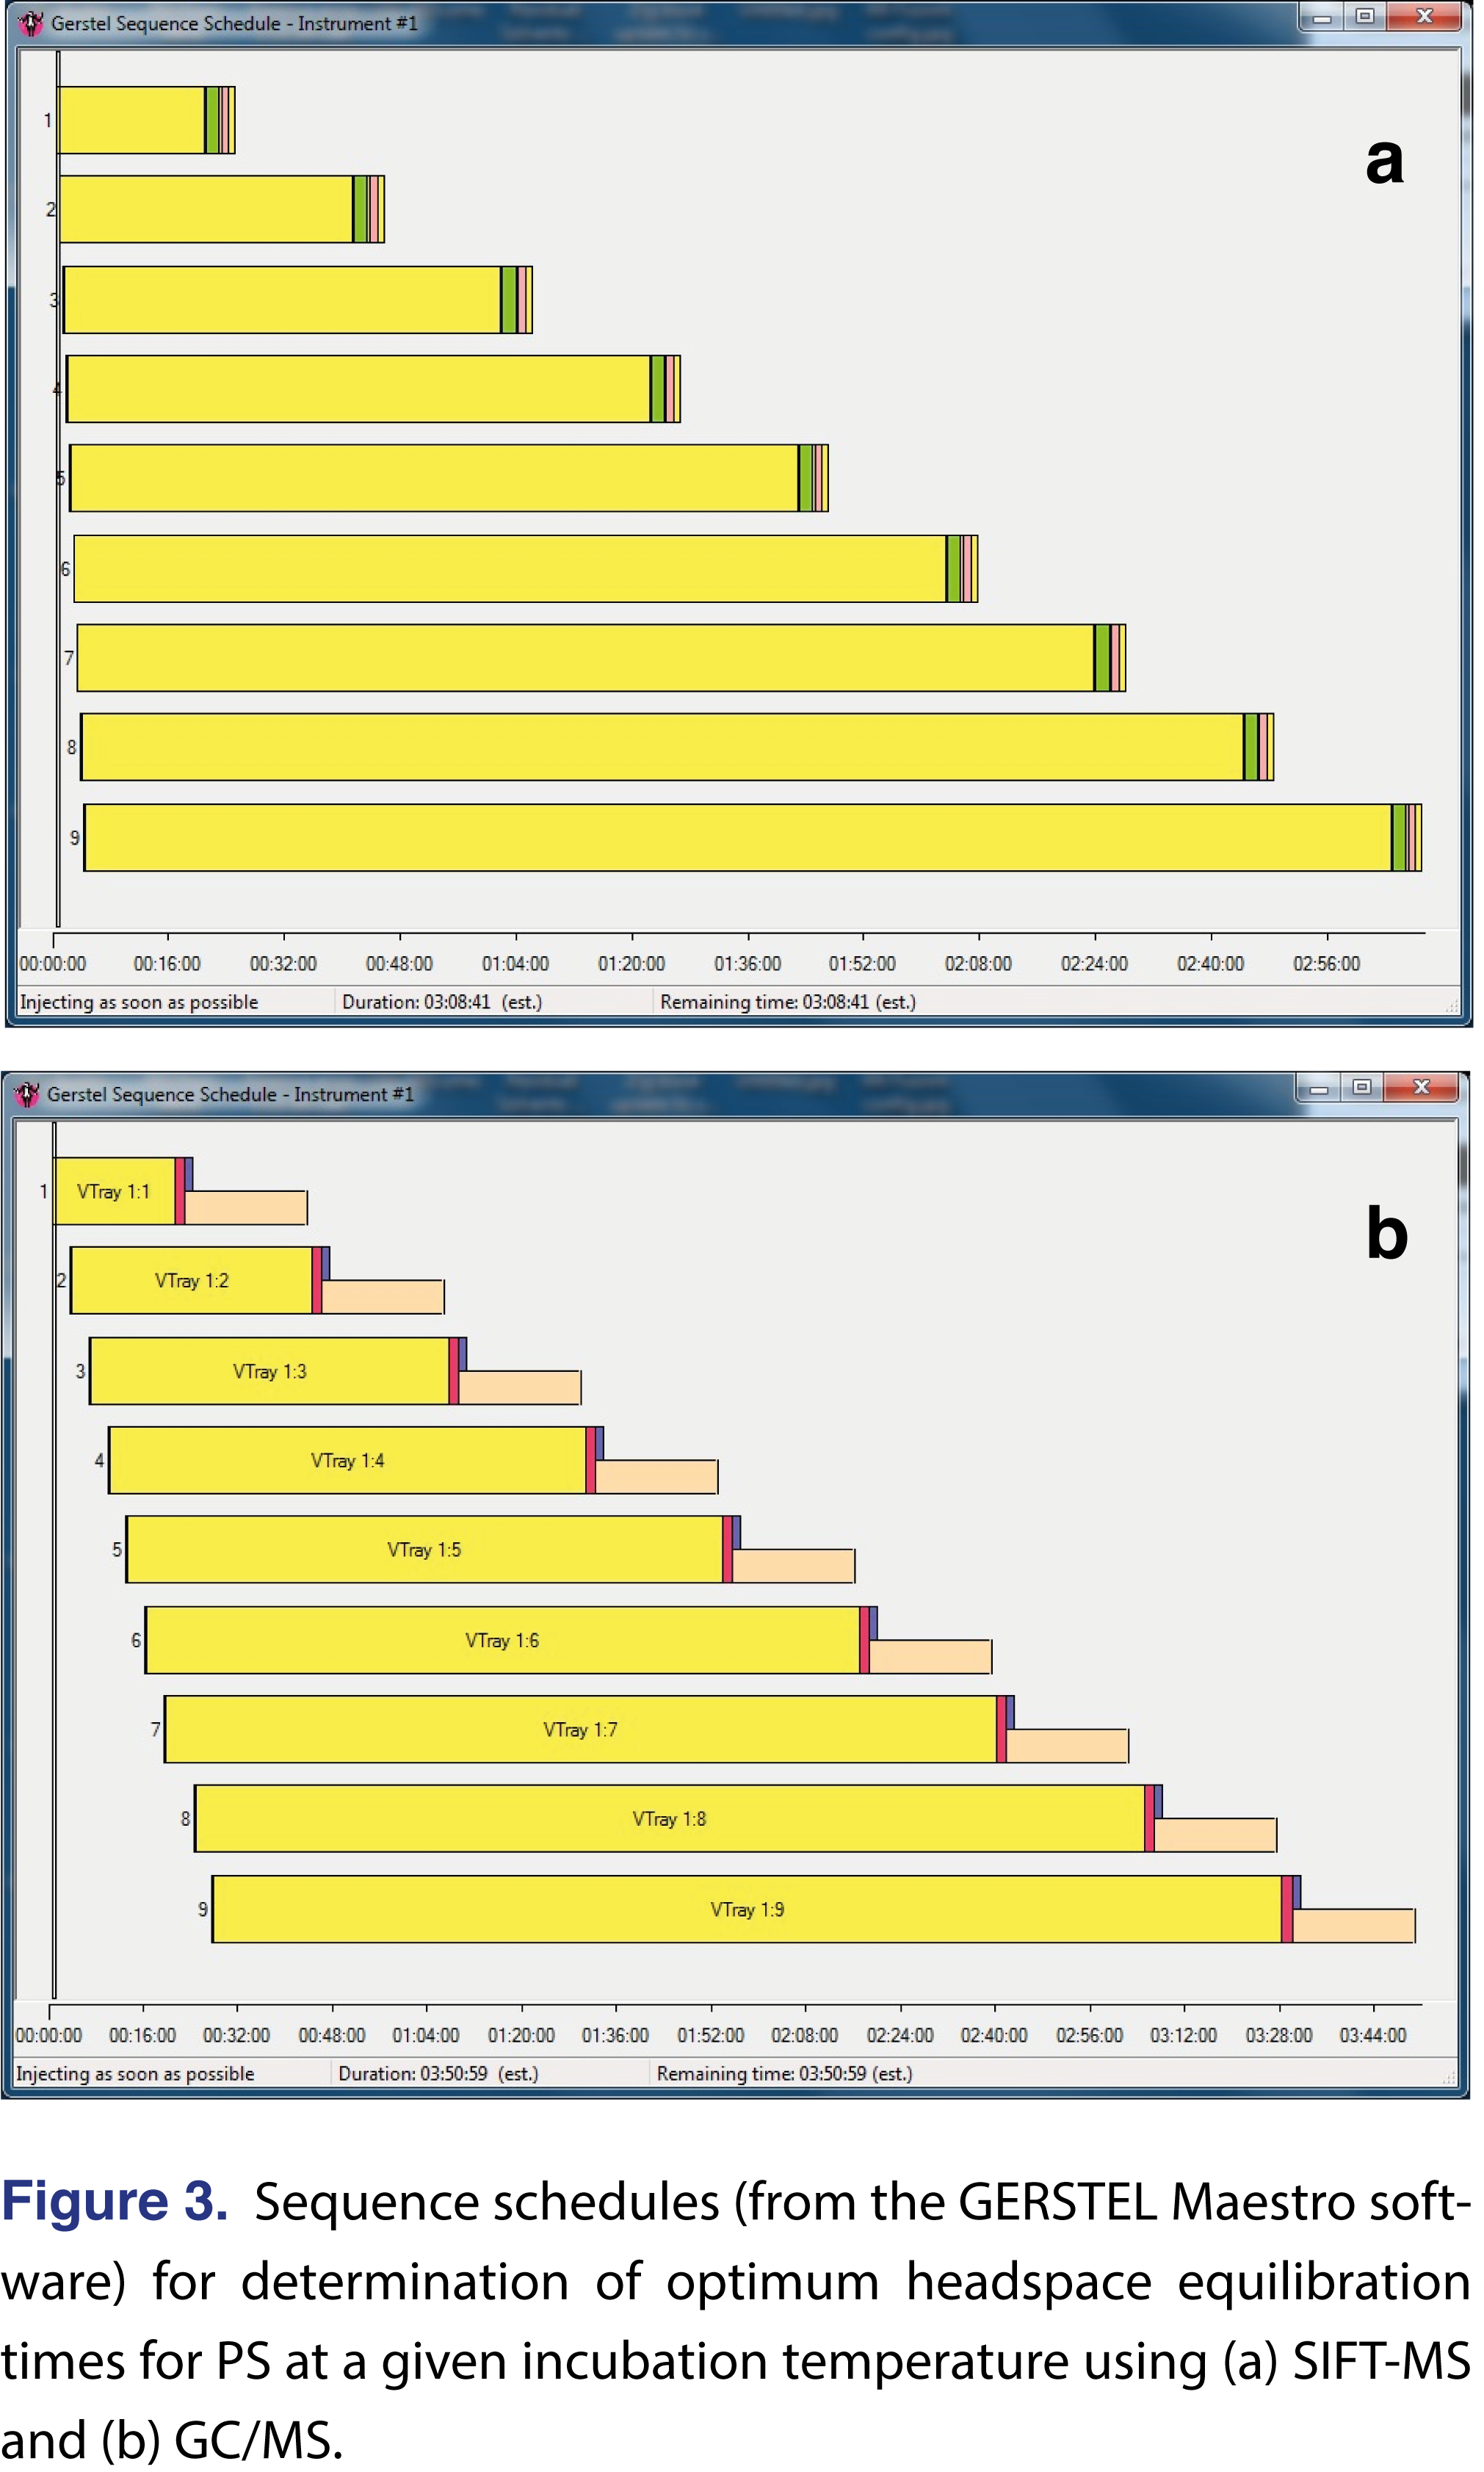
Determination of HS equilibration times can be conducted efficiently using SIFT-MS because of the rapid sample analysis. The relevant sequence schedule is shown in Figure 3(a), where for each incubation temperature the entire equilibration investigation can be completed in little more than the maximum equilibration time (189 min. vs 180 min.) when using two six-position agitators. For comparison, if using GC/MS, then the same study would take 231 min. (Figure 3(b)). In this study, SIFT-MS does not provide a significant benefit over GC/MS because the 20-min. steps in incubation time are sufficient for GC/MS analysis to be conducted. SIFT-MS is advantageous when the time resolution in the HS equilibration investigation is shorter.
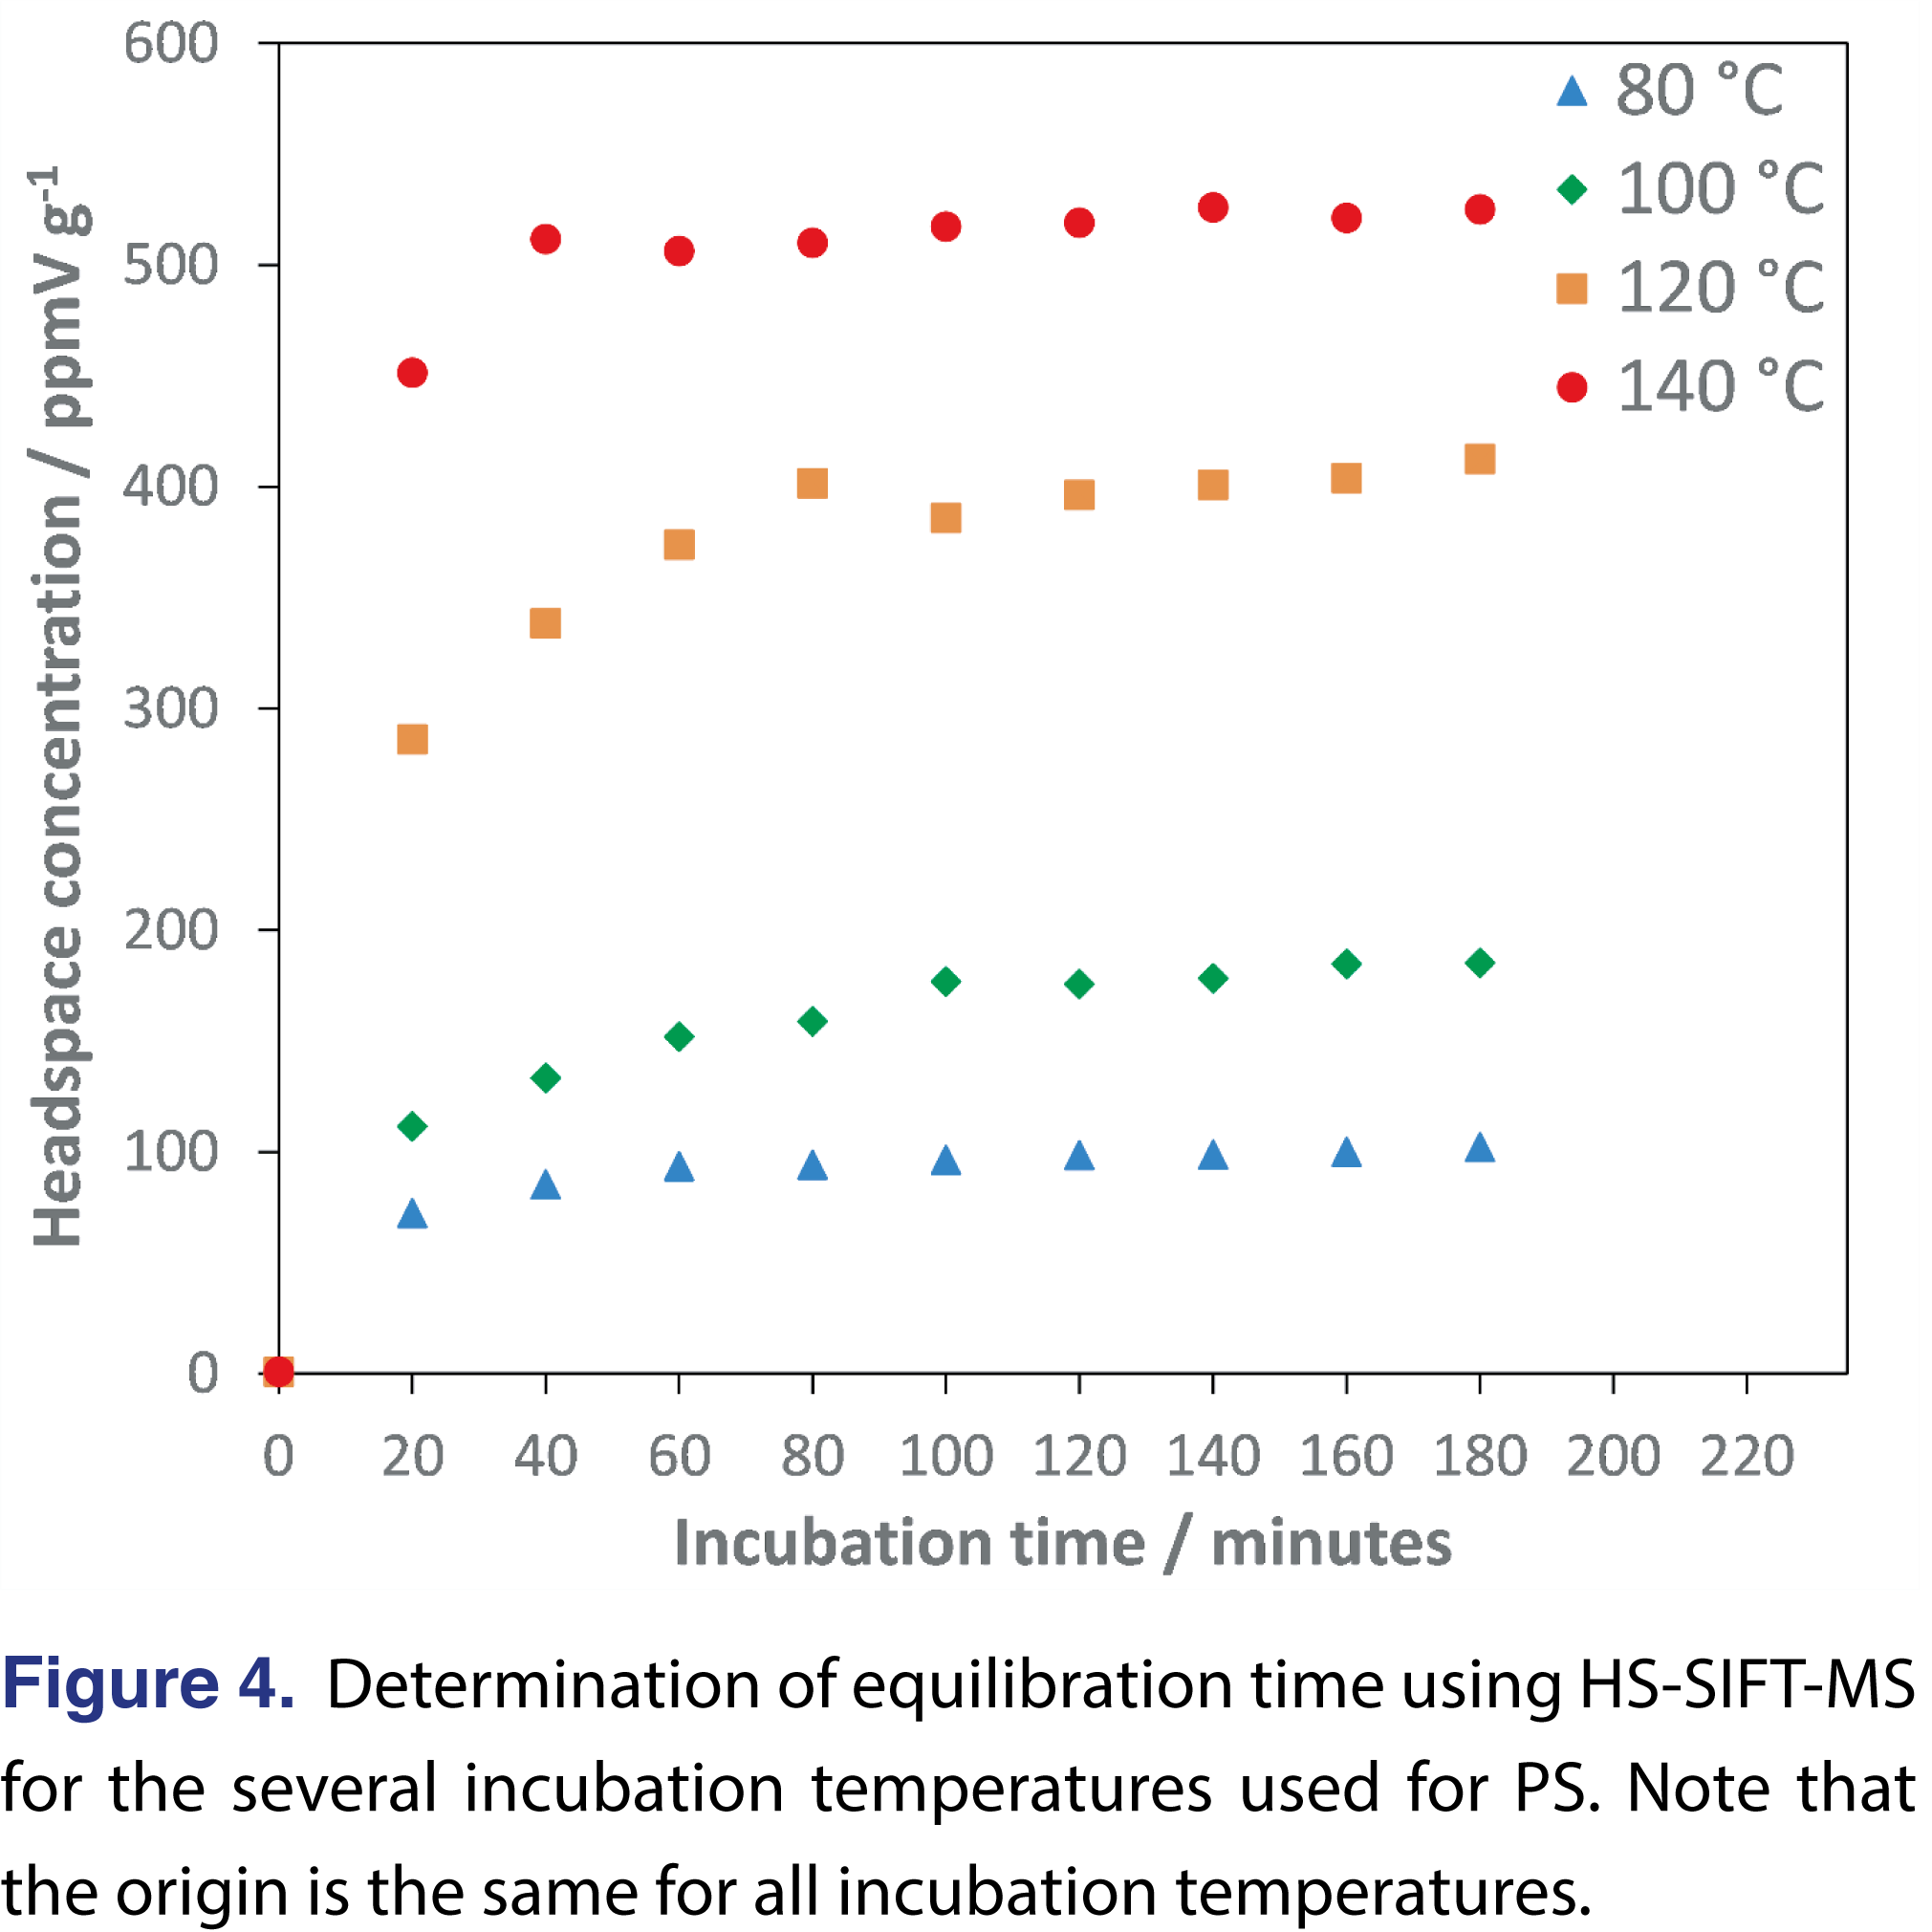
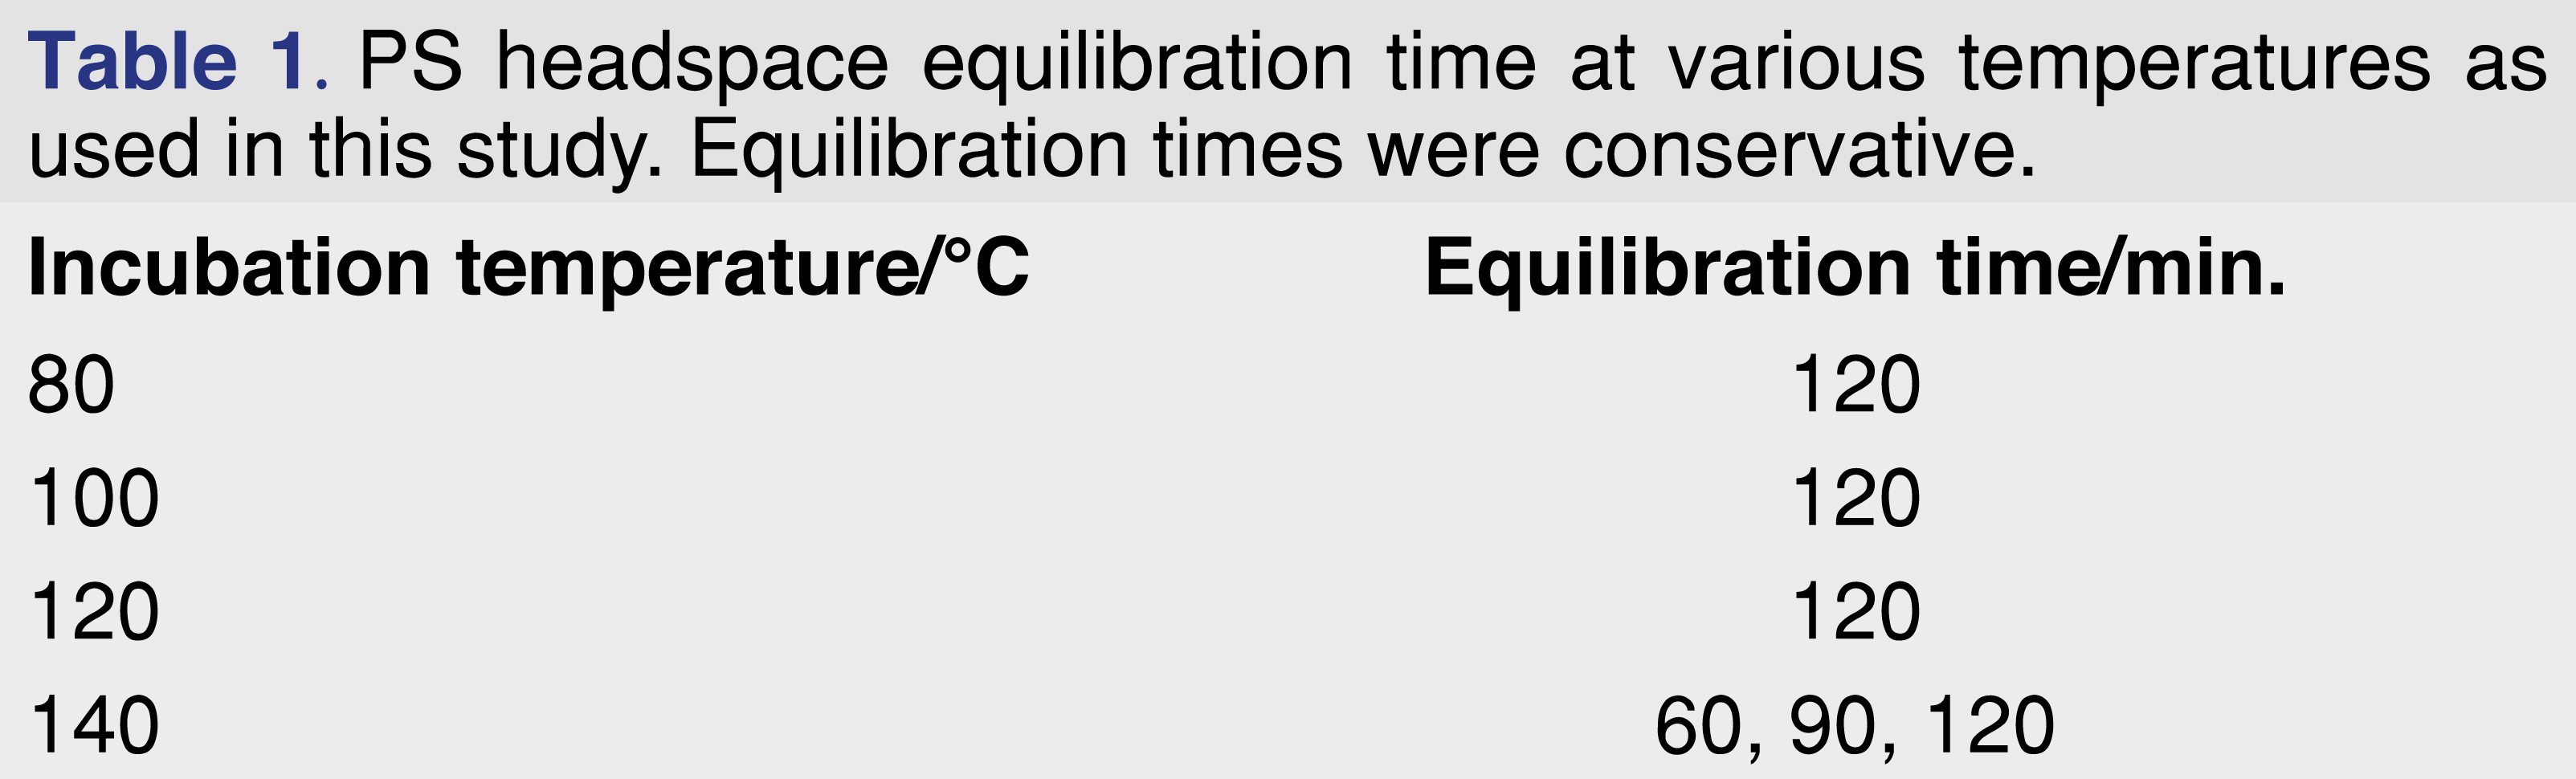
The results obtained for the HS equilibration study are shown in Figure 4, with the optimal equilibration time for each temperature summarized in Table 1. Shen et al. [8] obtained a similar equilibration time at 120°C for 400 mg samples in 20-mL HS vials, suggesting similar particle size to this study. In contrast, Kolb et al. [5] obtained a 40 min. equilibration time at 120°C for 100 mg samples in 24-mL HS vials, suggesting a smaller grind was used in their study. Note, however, that when optimizing sample throughput for routine analysis it can be advantageous to use incubation times longer than the equilibration time (see Discussion).
2.3.2. Headspace Purge Time
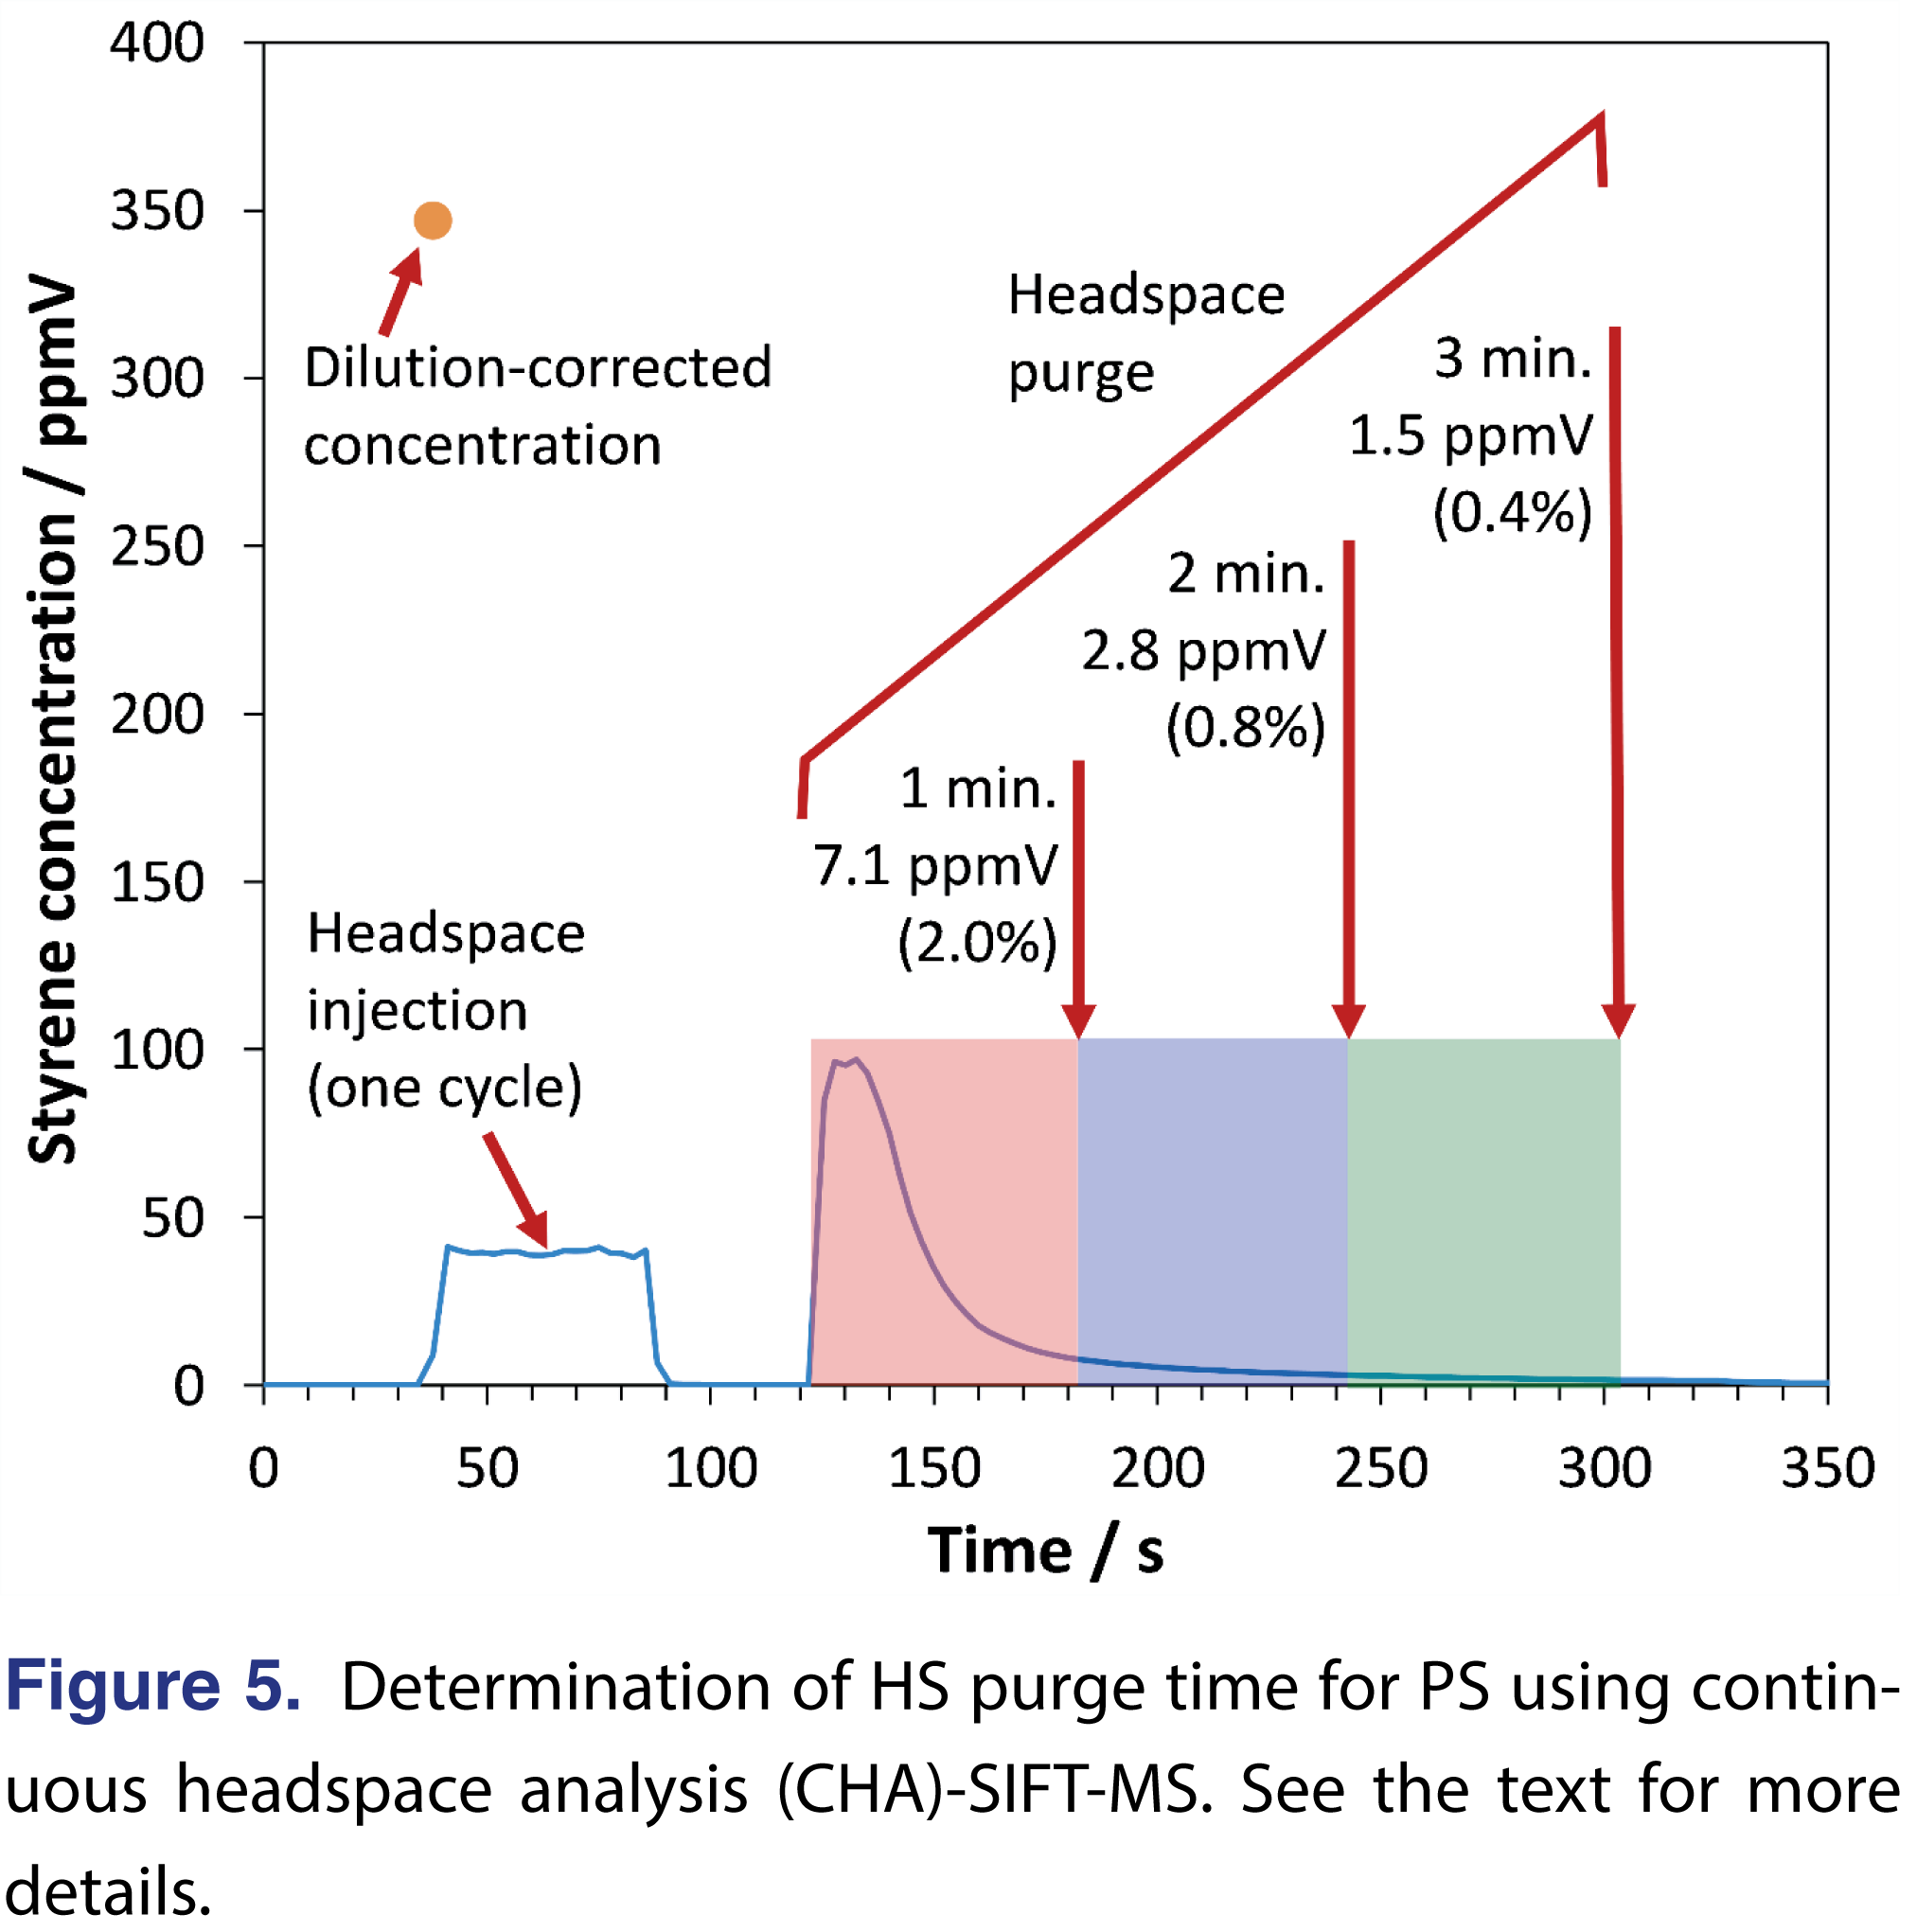
Since the sample HS must be purged prior to each regeneration cycle in MHE [6], the purge time was optimized. The real-time analysis provided by SIFT-MS made this a trivial procedure. Figure 5 shows the results obtained for one of the samples incubated at 140°C. In the first phase (from ca. 40-85 s), the HS from the incubated sample was injected into a stream of make-up gas (high-purity nitrogen) in the inlet of the SIFT-MS instrument. The dilution-corrected concentration is indicated as a dot at top left in Figure 5. Between ca. 85-120 s the autosampler transferred the sample from the agitator to a sample tray and attached the GERSTEL purge tool. A 200-mL/min purge with high-purity nitrogen is undertaken from ca. 120 s. The SIFT-MS instrument analyzes a portion of this purge gas using a flow-past configuration (since the SIFT-MS instrument inlet draws sample at ca. 25 ml/min). Since less than 1% of the HS remains after 2-min., this purge time was adopted for the MHE method.
2.3.3. Calibration of SIFT-MS Styrene Measurement.
The final consideration for method development is calibration of the SIFT-MS analysis of styrene (data presented up to this point represent quantitation from first principles based on pseudo-first-order kinetics [14,15]). Calibration from HS samples is a straightforward procedure in non-reactive solvents (e.g., water) [10,11] but the approach utilized with MHE-GC used a dimethylformamide solution of styrene [5], which is incompatible with SIFT-MS.
Styrene calibration was achieved by gas-phase serial dilution on the autosampler platform. Styrene was placed in a vial at 40°C and allowed to equilibrate, yielding a ‘stock’ gas calibration standard with concentration of 18,750 ppmV based on the vapor pressure [25]. Aliquots of HS were sampled into seven vials pre-filled with high-purity nitrogen using a serial dilution approach. Because this was done quickly, it was assumed that the HS did not re-equilibrate, so subsequent aliquots were of slightly reduced concentration (correction was based on the volume extracted). Plotting measured concentration versus expected concentration over the range 0 to 50 ppmV, a slope and linear regression coefficient (R2) of 0.7666 and 0.9969, respectively, were obtained. Hence, the results presented below have the data calibrated accordingly.
3.0. Results
In the present study, full six-cycle MHE-SIFT-MS analyses were conducted on six replicate samples of PS at six incubation temperatures (80, 90, 100, 110, 120, and 140°C). More temperatures were investigated than in the HS equilibration study above because initial data indicated that PS was an ideal polymer in which to probe the impact of Tg on the completeness of residual monomer extraction – something achieved much more efficiently using SIFT-MS than GC/MS. Comparative performance for several incubation times at the optimal extraction temperature (140°C) was also investigated.
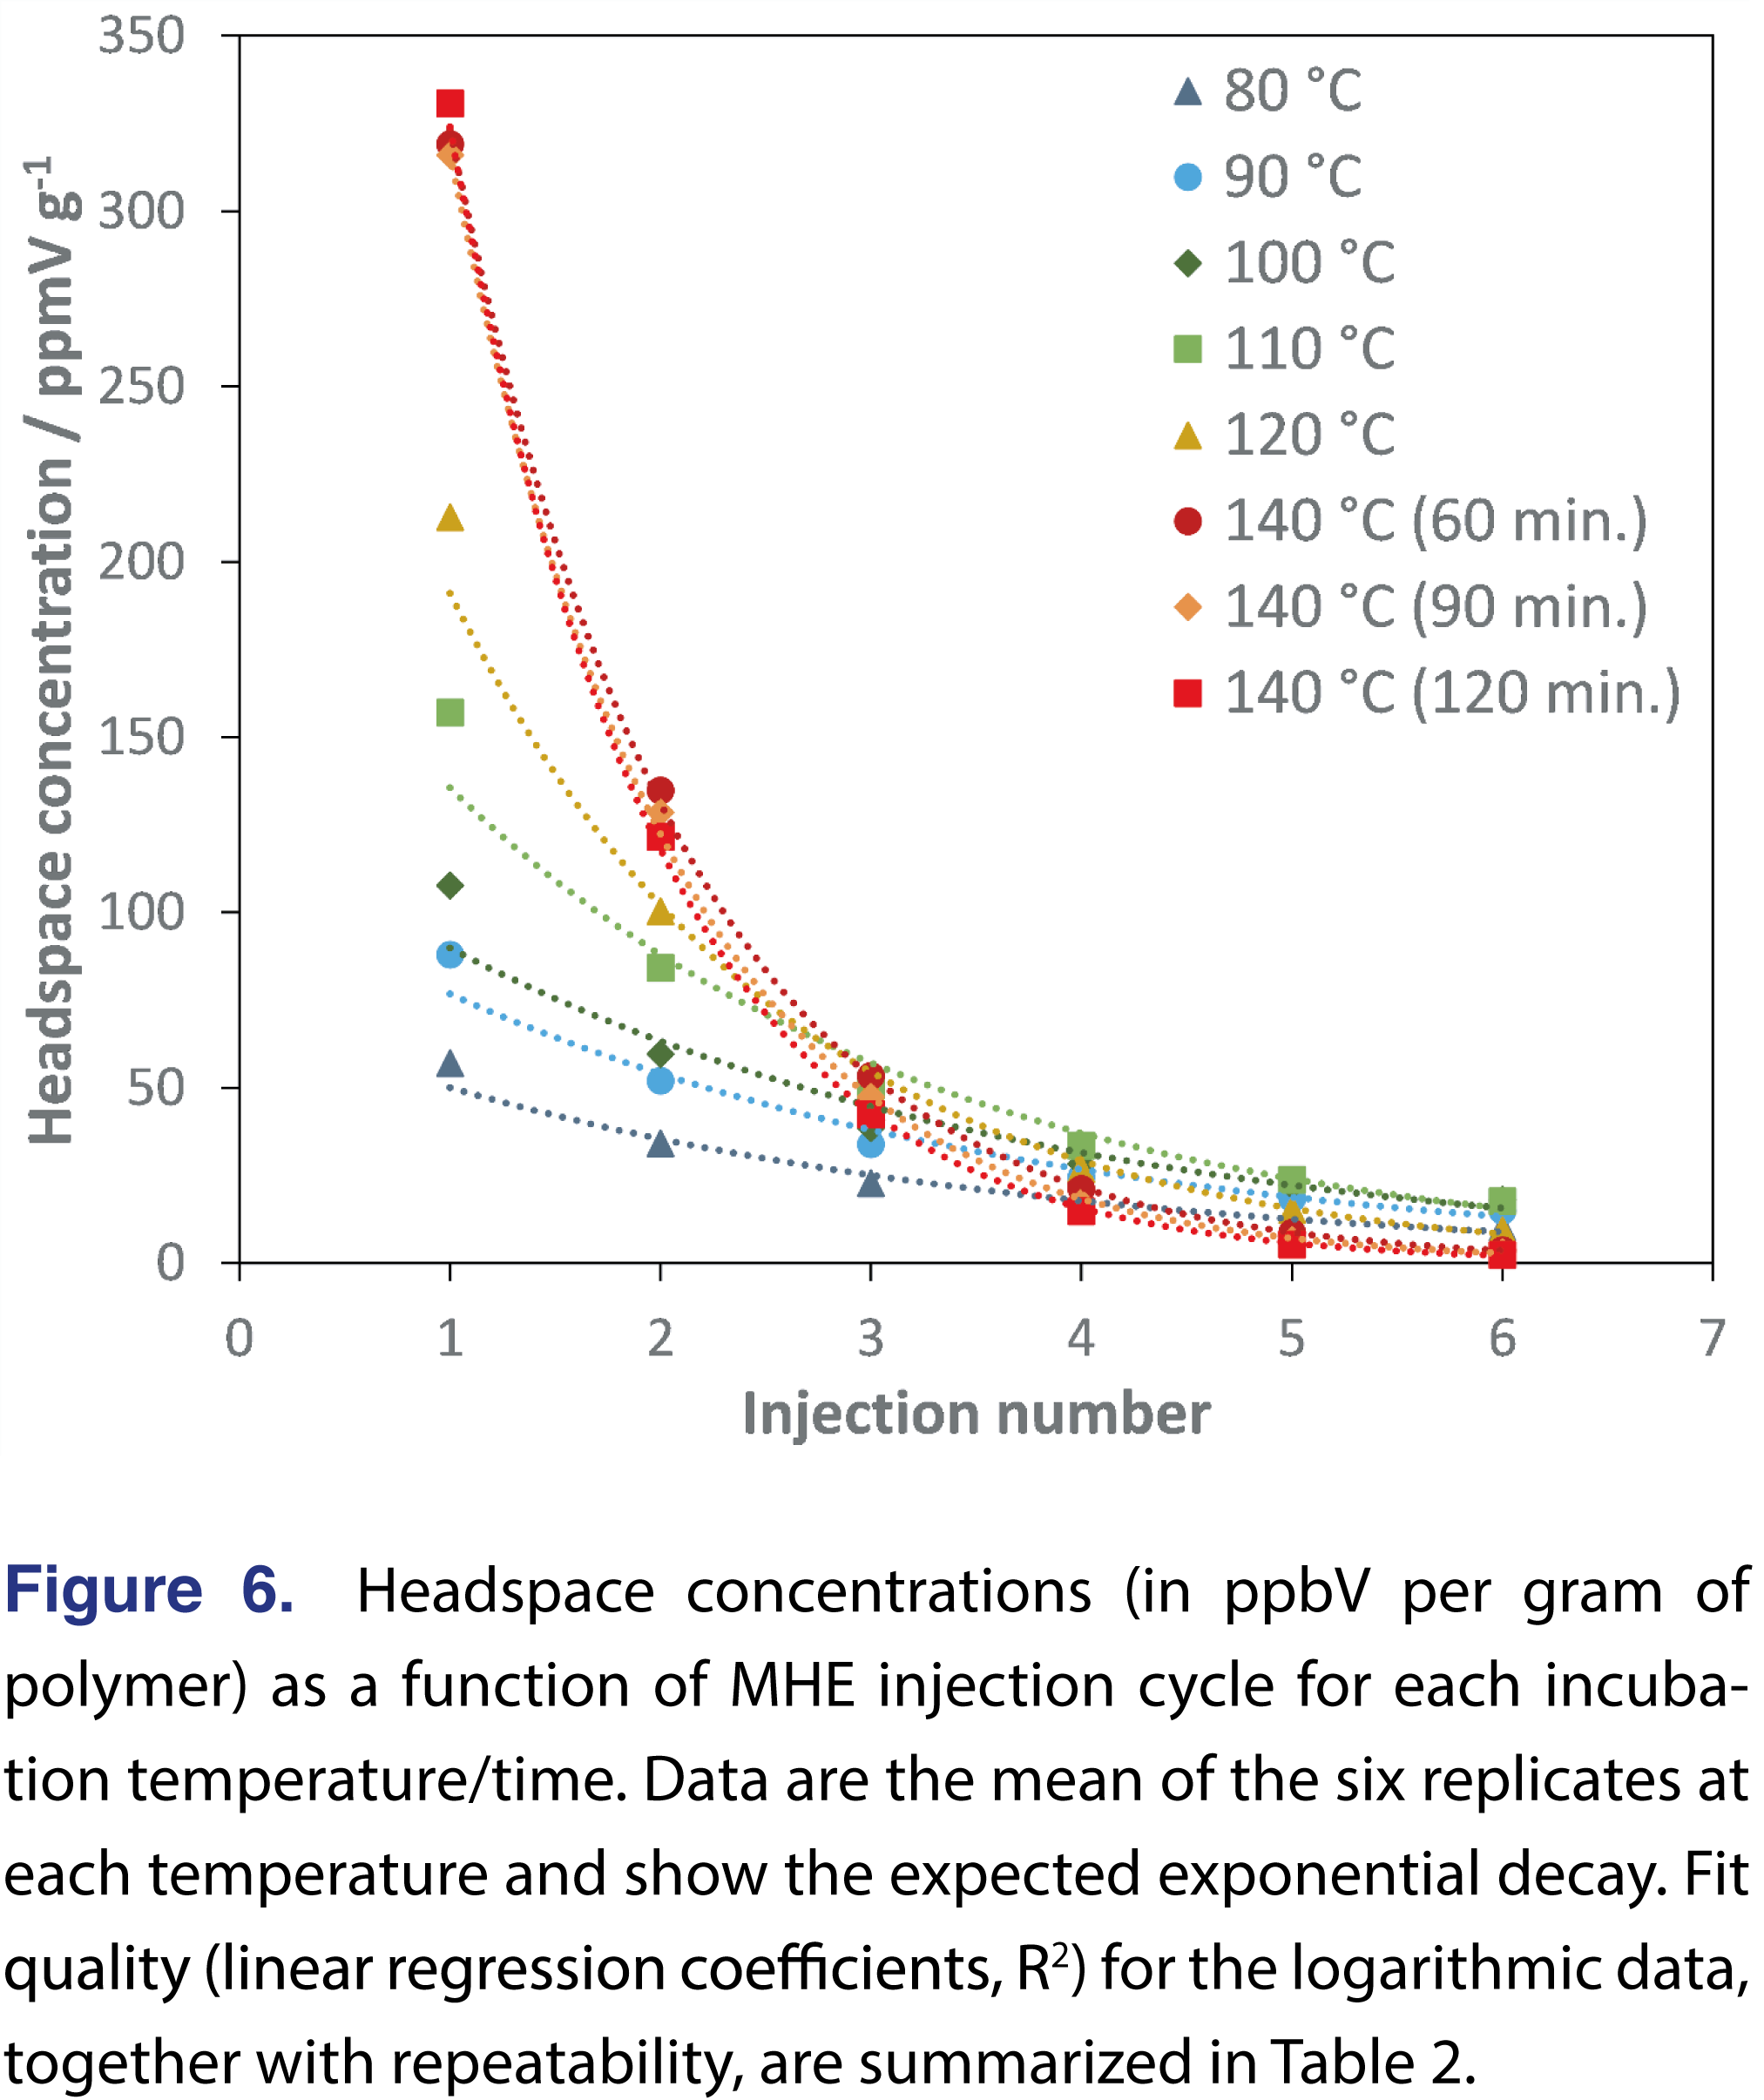
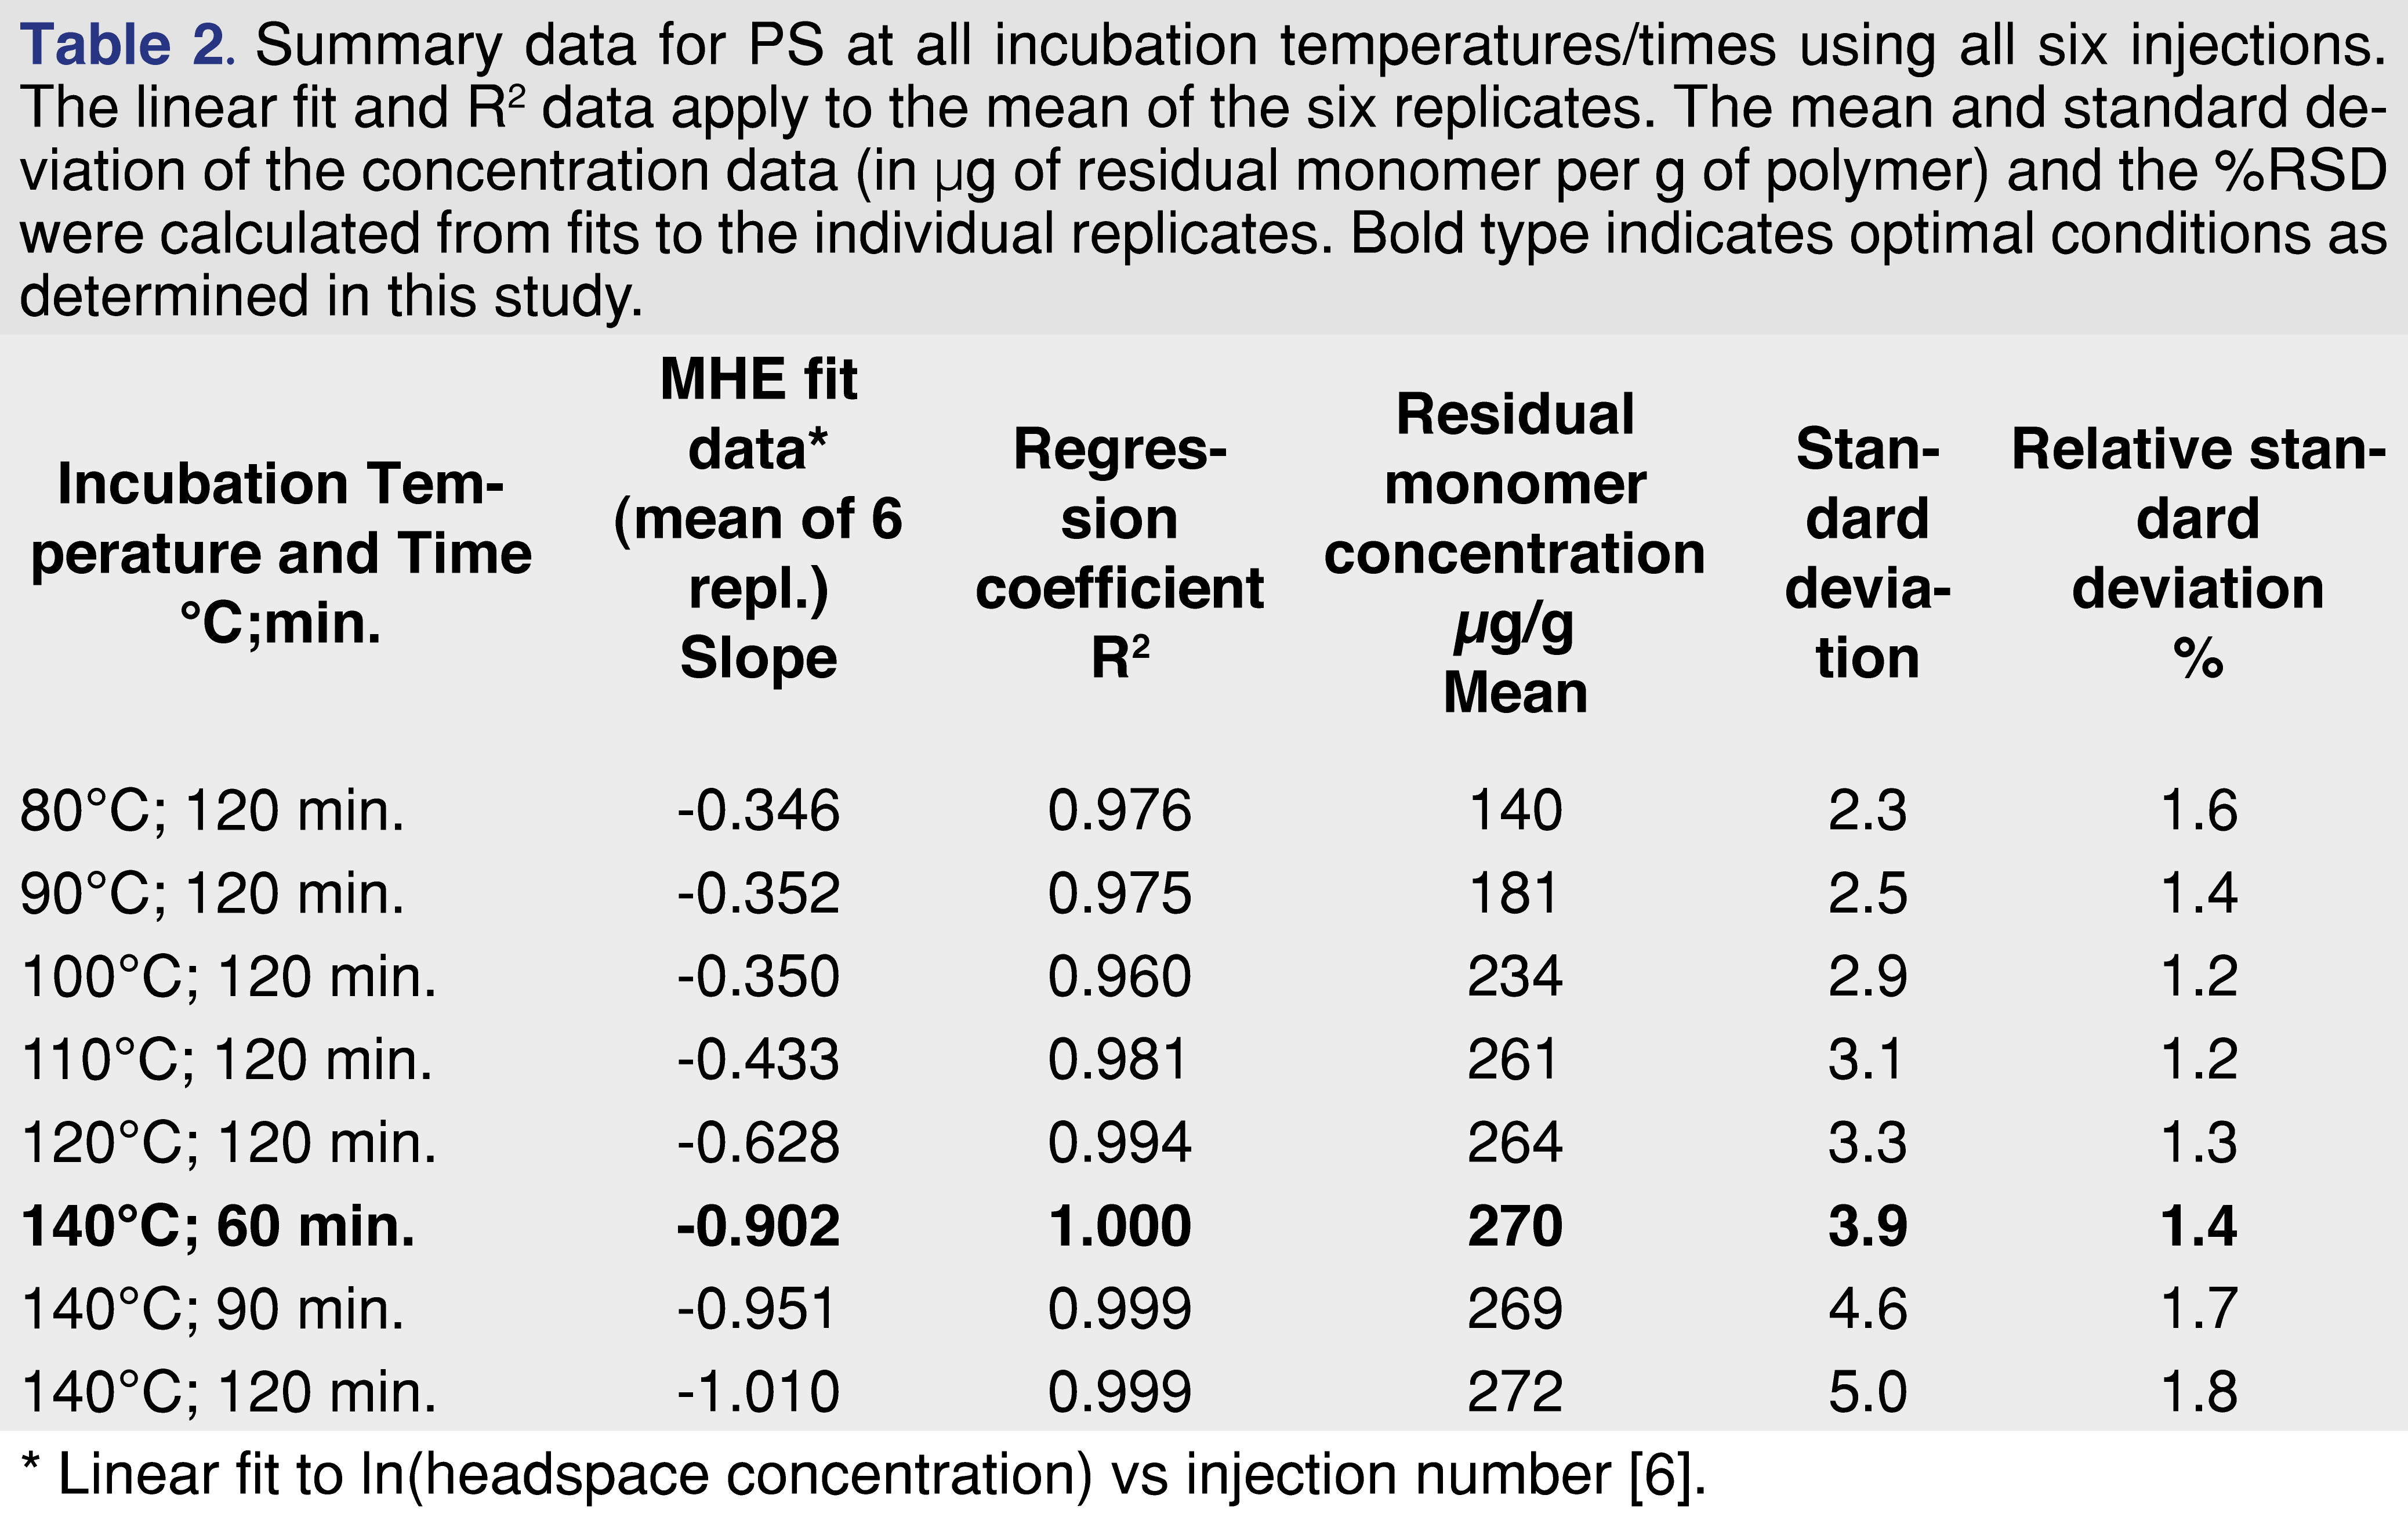
The HS concentration data (volume-to-volume scaled per gram of polymer) as a function of MHE injection number are shown in Figure 6. For clarity, these data are the mean of the six replicates. In general, a better exponential fit to the data (as indicated by the regression coefficient, R2, being closer to unity) is observed at higher incubation temperatures where the decay of HS concentration is greater. Taking the natural logarithm of the HS concentration data in each dataset shown in Figure 6, gives linear fits as summarized in Table 2 by the slope and regression coefficient (R2). The slope is used to calculate the concentration of residual monomer (in ppmV/g) using equation (1) [7]:
Conc.(ppmV/g) =
Conc. (Inj. 1) / (1 – eslope) (1)
To convert to mass of volatile residue in the polymer sample:
Conc.(µg/g) =
(1000/0.0821) x Conc.(ppmV/g) x V x DF x Mr /T (2)
Here:
V is the volume of the HS vial, in m3; DF is the dilution factor in the SIFT-MS sample inlet (in this case, 8.535); Mr is the molecular weight of the analyte, in g/mol; T is the incubation temperature, in K.
The values 1000 and 0.0821, respectively, are unit conversions and the ideal gas constant in L.atm/K.mol.
This calculation was applied to all replicates individually to assess repeatability. The mean concentrations of residual monomer in the respective polymers (in µg/g) are given in Table 2, together with the standard deviation (s.d.) and relative standard deviation (%RSD). Repeatability, as measured by %RSD), is excellent at <2% and is characteristic of HS-SIFT-MS [10,11].
4.0. Discussion
The results presented above demonstrate that SIFT-MS and MHE are compatible, yielding highly repeatable residual monomer concentrations for PS. In this section, several points are discussed: (1) the general applicability of MHE-SIFT-MS to polymer analysis in terms of initial decisions on HS parameters in relation to physical properties, (2) the optimization of sequence schedules to maximize throughput, (3) the reduction of HS generation cycles from six to three, (4) correlation of MHE with static HS analysis, and (5) the scope of application of MHE-SIFT-MS.
4.1. Optimized MHE Conditions
Although previously published conditions from static HS-SIFT-MS are generally applicable to MHE-SIFT-MS, the goal of the MHE technique is to achieve efficient extraction of volatiles from the polymer matrix. Hence polymer pellets are typically freezer milled to the 100 – 250 µm range [5,8] to minimize migration time of residual monomer. That this goal is achieved is evident in a steep decay in HS concentration (Figure 6) which is well modelled using a linear fit when the natural logarithm is taken (Table 2) – yielding a slope that is more negative. Shallow decays (indicated by less-negative slopes in log form) indicate lower HS partitioning, which results in lower sensitivity and poorer precision. Generally, it is evident in Table 2 that incubation temperatures above the glass transition temperature (Tg) give the best results by these measures. This is confirmed by plotting the absolute value of the slope as a function of incubation temperature (Figure 7), which demonstrates that optimal extraction is only achieved above the glass transition temperature – a region in which polymer chains are more mobile and hence release from deeper in the polymer is facilitated. At lower temperatures, only monomer closer to the surface is released. However, it should be noted that there is risk of “over-partitioning” to headspace (a topic that will be tackled in Part 2 of this study, and it is recommended that incubation temperatures 20 to 40°C above the glass transition temperature be utilized (while also taking into consideration the temperature at which the polymer starts to thermally decompose).
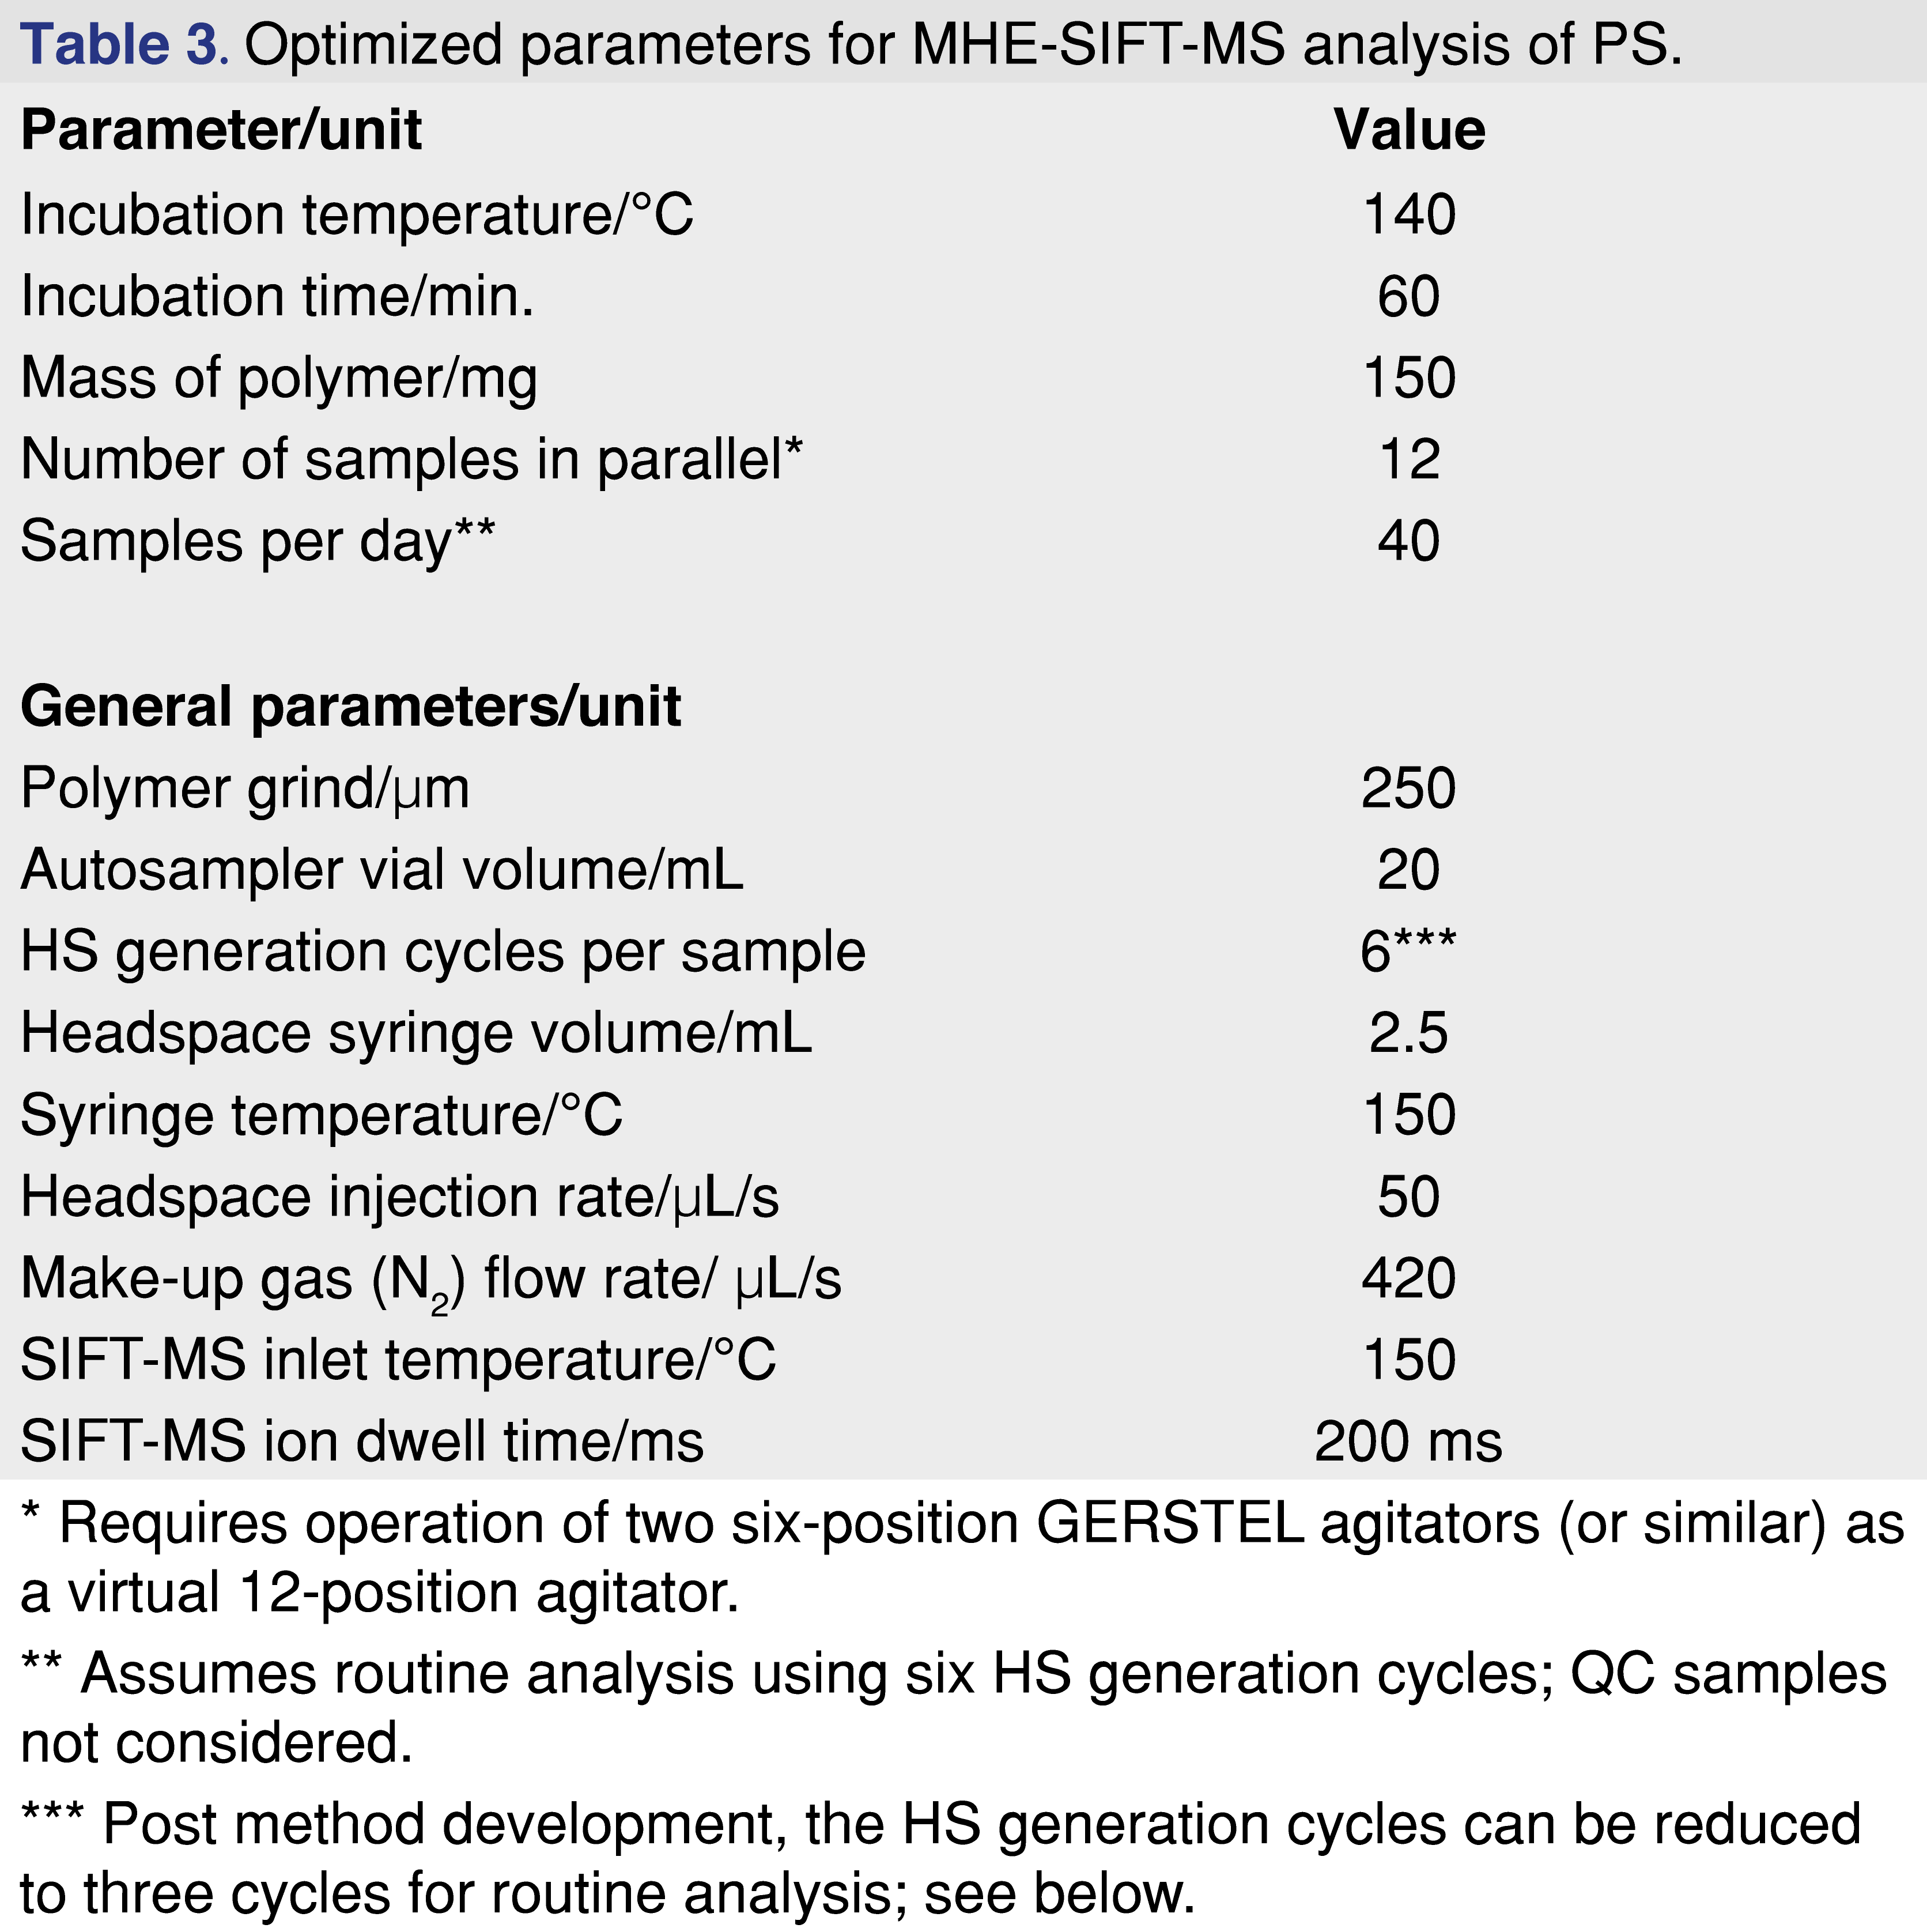
For PS, the influence of incubation time (60, 90, and 120 min.) was reinvestigated at the optimal incubation temperature (140°C). Within experimental uncertainty, the same residual styrene was extracted at each incubation time, indicating that equilibrium is achieved at 60 min. Given that the best repeatability was also achieved at this temperature, future work should utilize 140°C incubation for 60 min. With the HS incubation temperature (or temperatures) selected for method development, the equilibration time is determined using the approach described in the Method Development section. Since for SIFT-MS this is a very efficient procedure, at least two incubation temperatures are recommended. At this point, the full parameter set for conducting MHE-SIFT-MS on PS (and similar “well-behaved” polymers) can be summarized (Table 3).
4.2. Sequence Schedule Optimization for Routine Analysis
Full MHE analysis is of long duration, due to six HS generation cycles, and hence is expensive to utilize in routine analysis. This is exacerbated by long HS equilibration times for PS; for example, 60 min. at 140°C even when a particle size of 250 microns is utilized to reduce the migration distance of styrene through the material. In fact, if only one sample can be analyzed at a time using six-cycle MHE, SIFT-MS provides little advantage over MHE-GC/MS (the former will only reduce the analysis time by ca. 30 min.). This subsection, therefore, describes strategies by which MHE throughputs can be increased, with the opportunities to do so relying upon the fast analysis time of SIFT-MS (compared to GC/MS) and the very high repeatability of MHE-SIFT-MS.
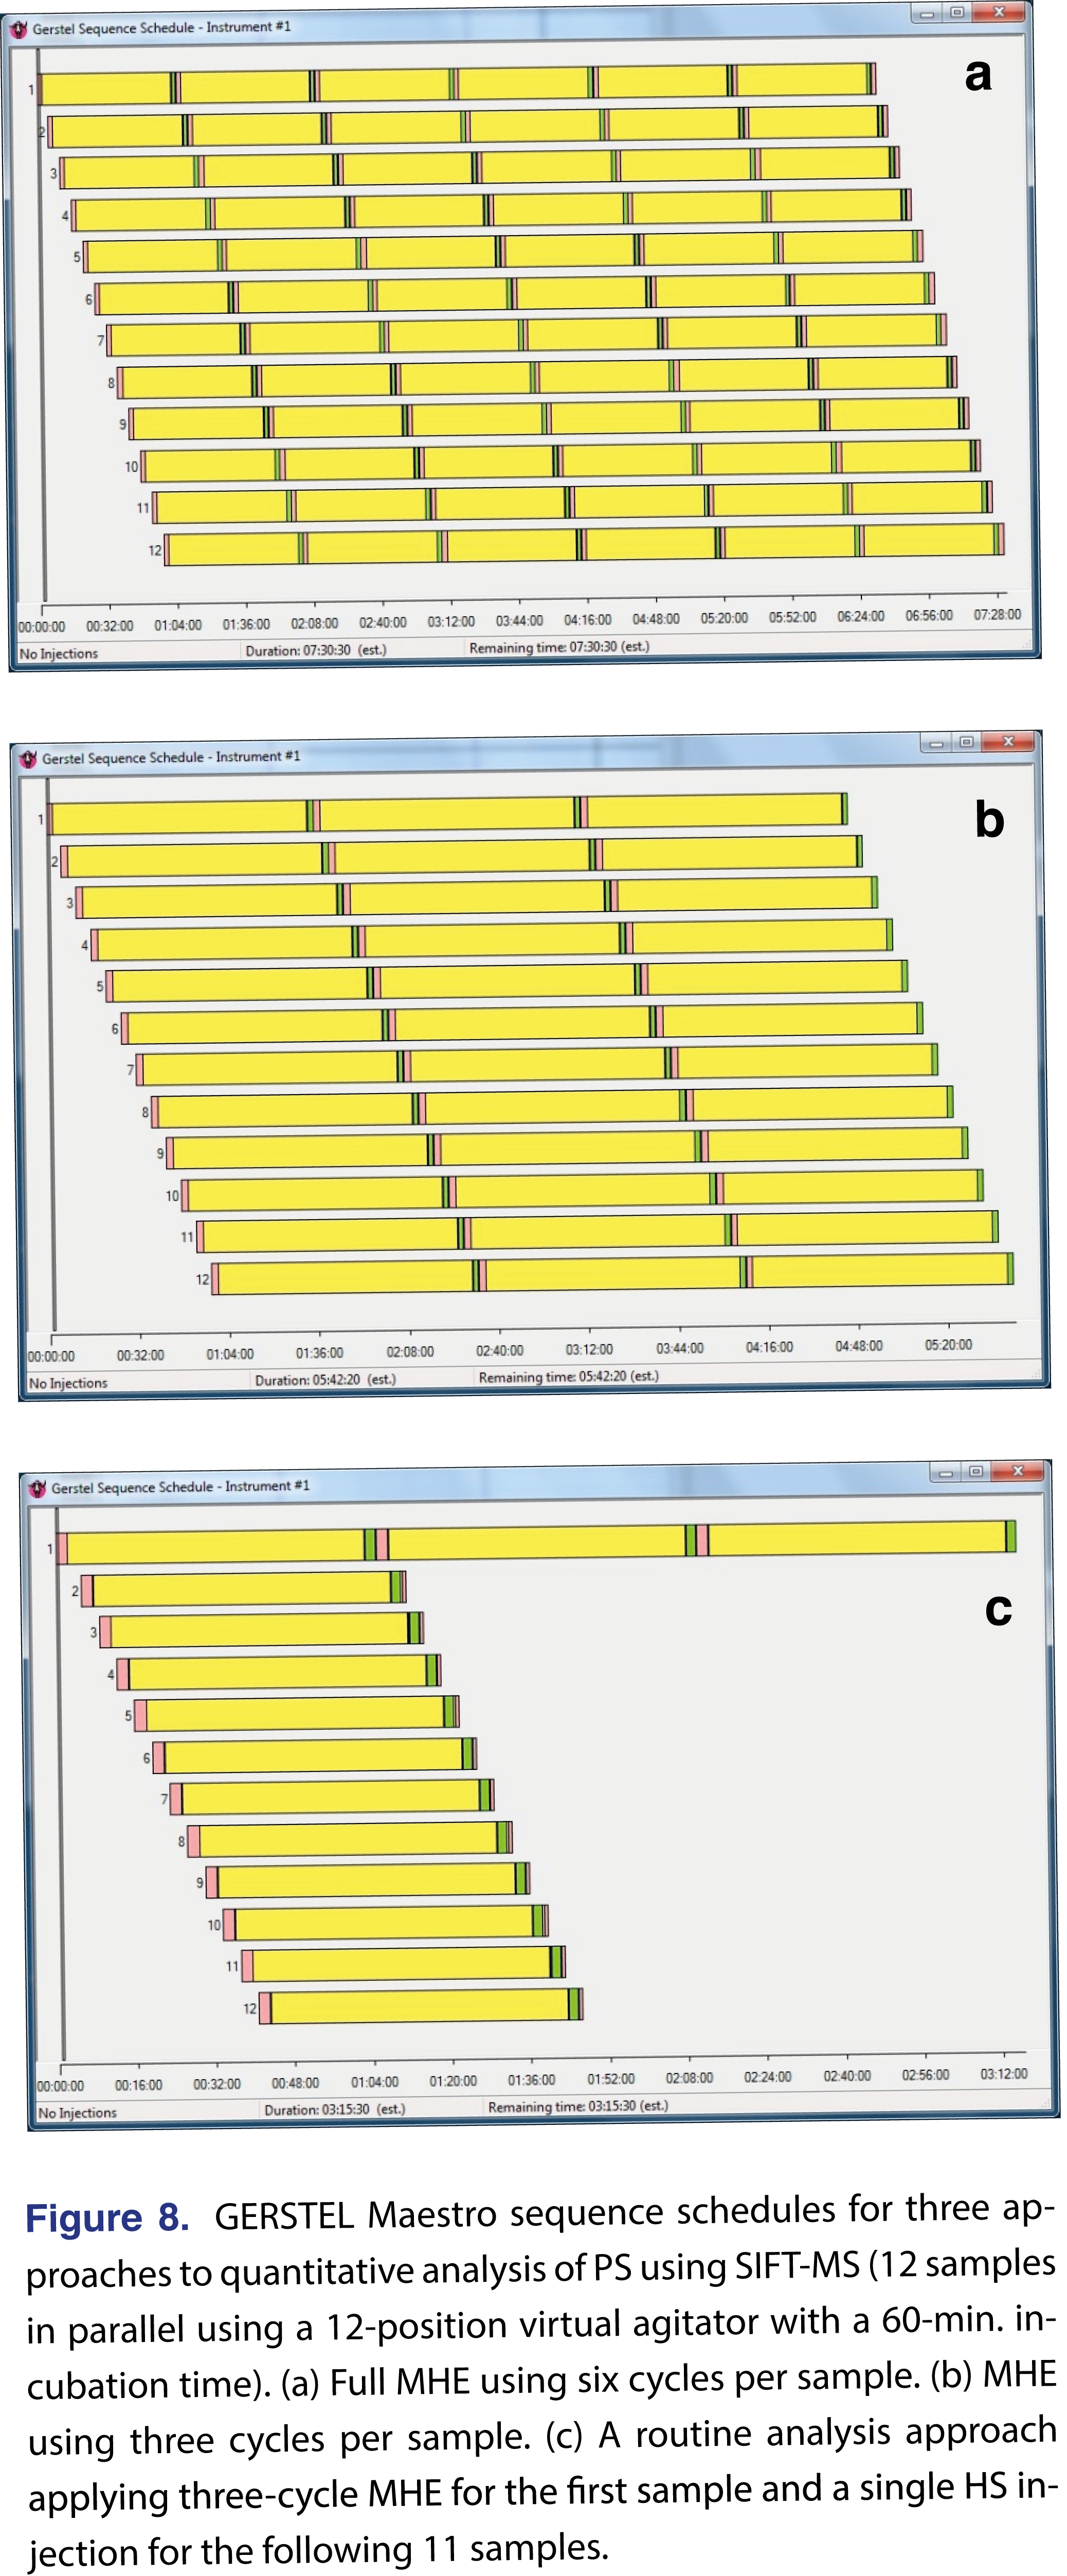
First, how can throughput be increased for full six-cycle MHE-SIFT-MS? Here, the rapid analysis of the SIFT-MS technique (less than two min. for any compound suite [10,11,24]) is a significant advantage because it enables multiple samples to be run in parallel. This is illustrated by the sequence schedule for PS analysis (Figure 8(a)), where each row represents a sample with its six HS generation cycles (yellow), SIFT-MS analysis (green), and headspace purge (pink). The autosampler configuration used in this study had two six-position agitators that the GERSTEL Maestro software package treated as a ‘virtual’ 12-position agitator, enabling 12 samples to be run in parallel. Instead of running less than three MHE samples per day in ‘linear’ single-sample approach, MHE-SIFT-MS can analyze 40 samples per day for PS under optimal conditions (140°C incubation for 60 minutes) – over eight-fold higher throughput than GC/MS.
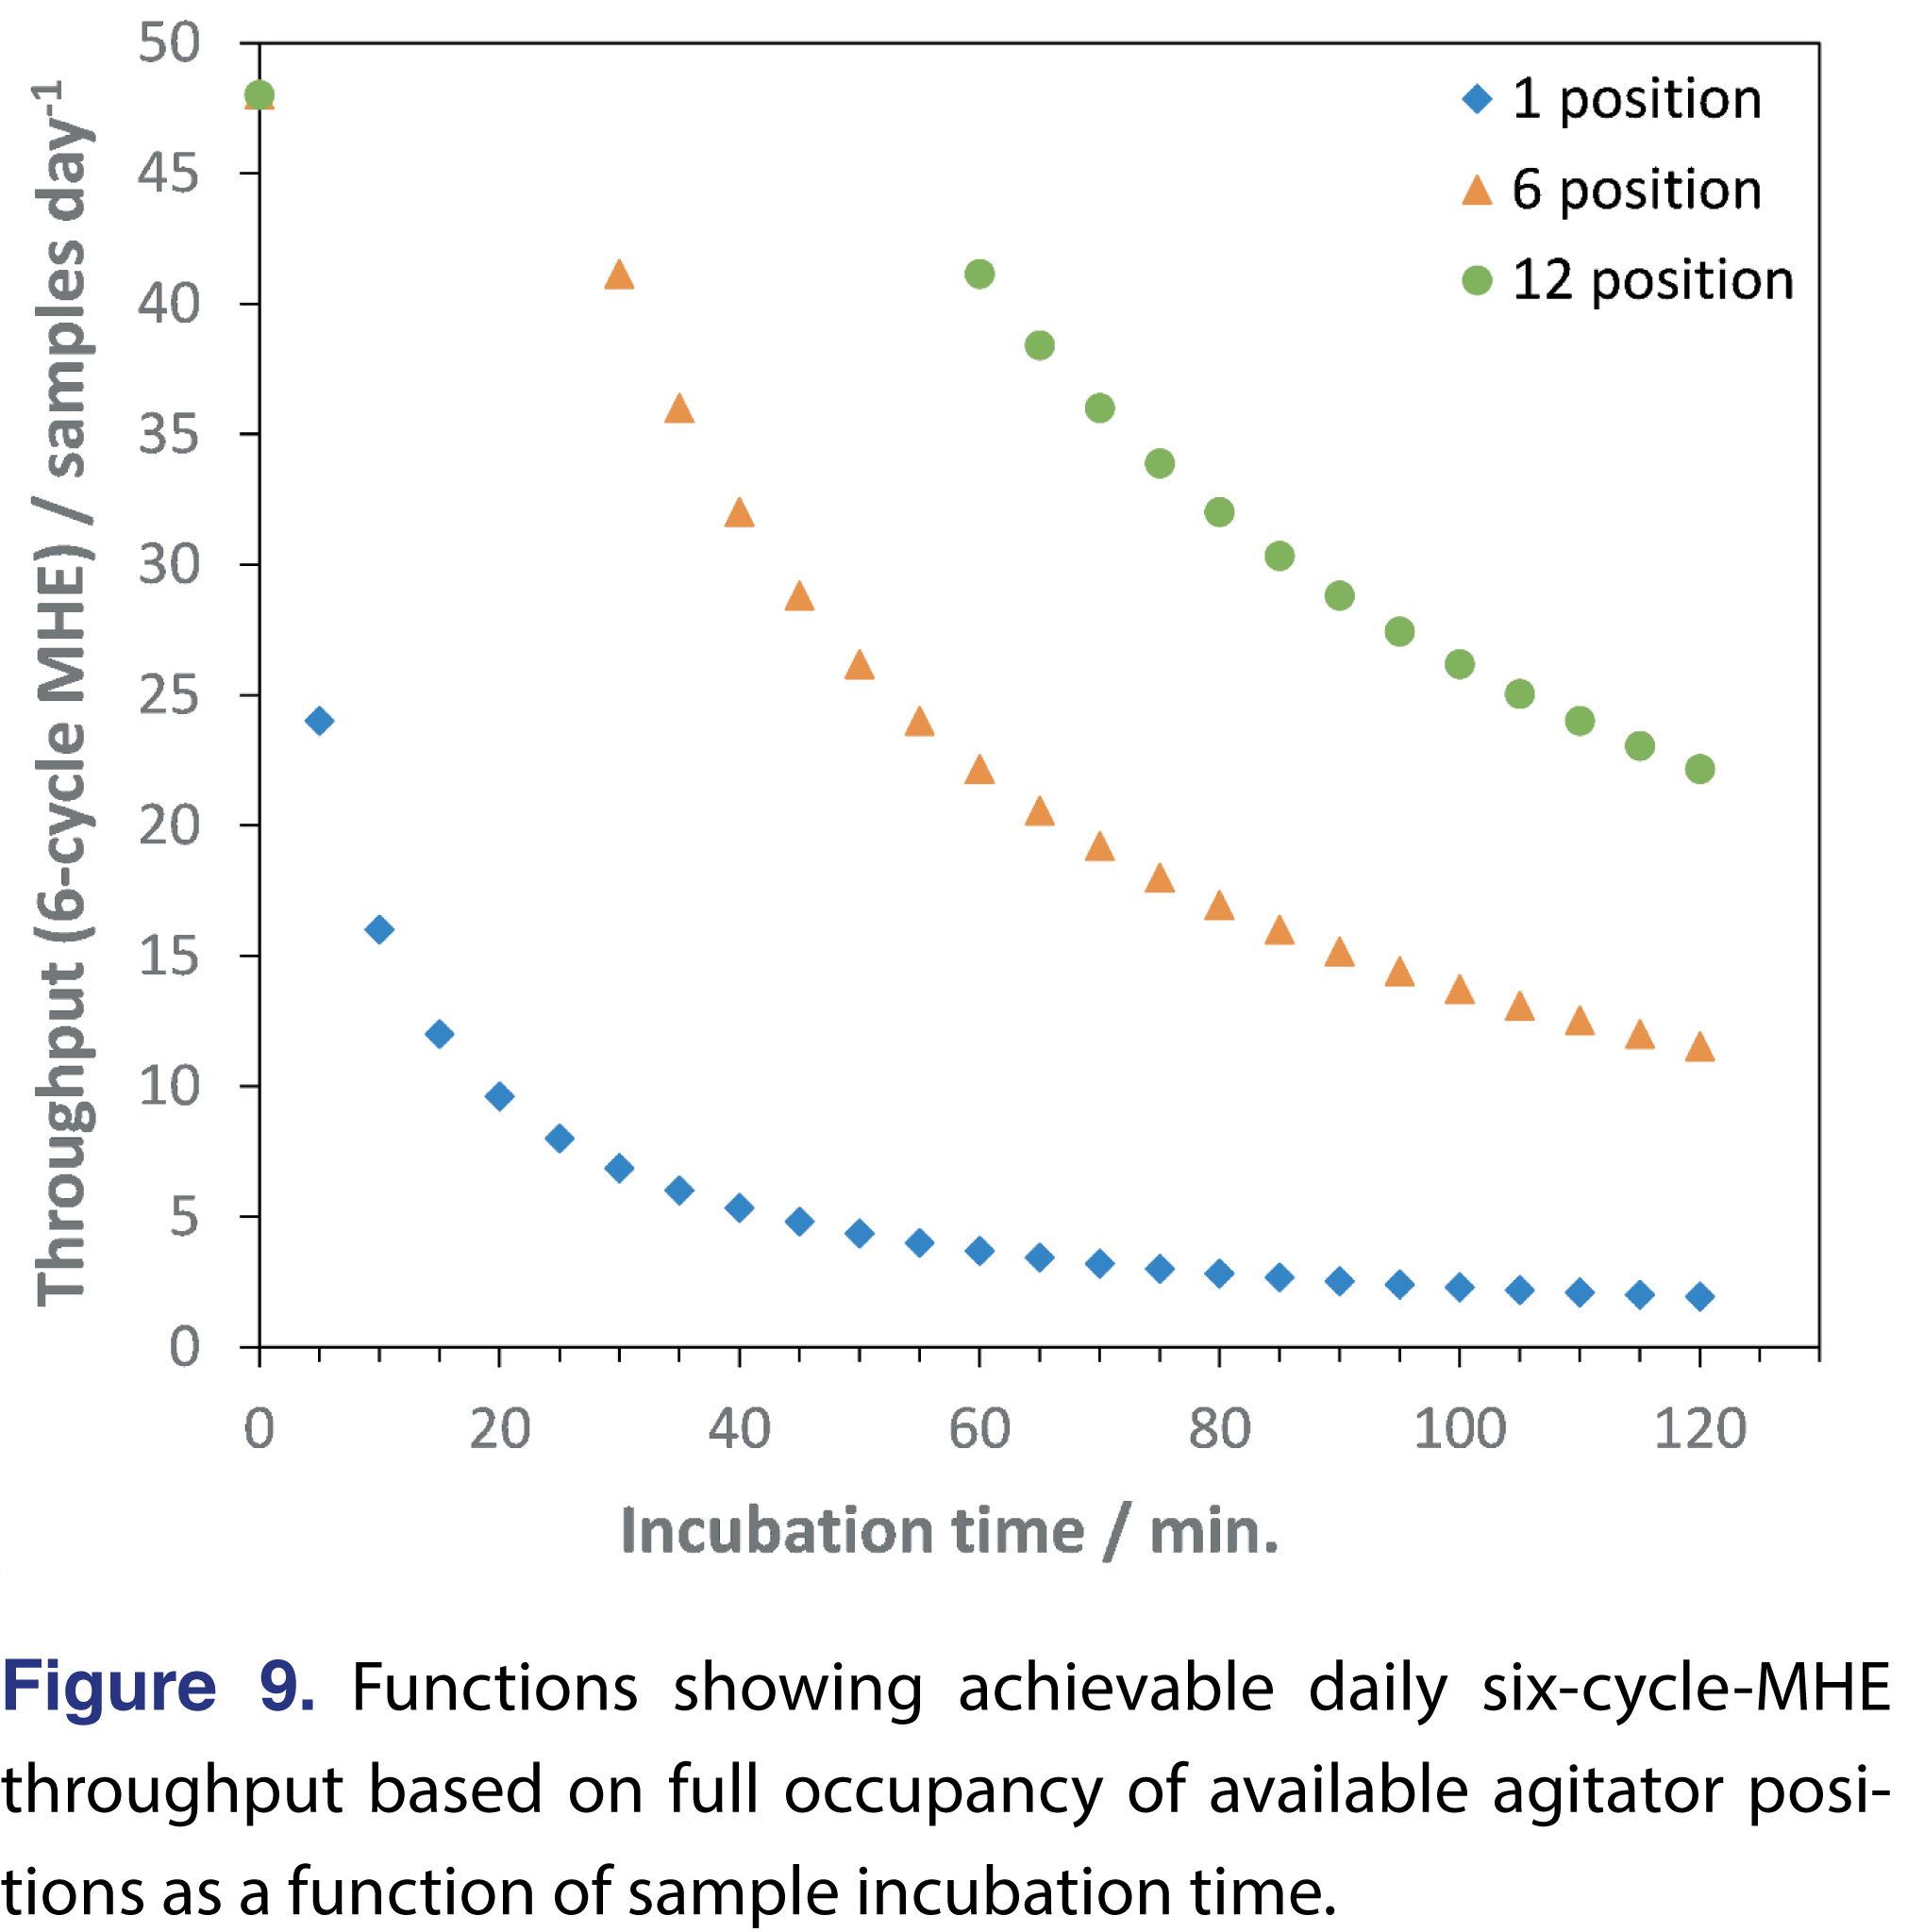
Because the combined SIFT-MS analysis and HS purge times will almost invariably be 5 min. or less, functions can be generated readily that enable schedule optimization through a combination of agitator configuration and equilibration time. Functions for six-cycle MHE are shown in Figure 9 and assume (i) full occupancy of available positions, and (ii) that the full batch must complete before the next one starts (i.e., mirroring Figure 8 sequence schedules). Throughput is optimal at the first point on each plot, otherwise, the SIFT-MS instrument sits idle until the incubation time for the first sample is complete. A consequence of this behavior is that in certain cases the highest throughput will be obtained by increasing the incubation time so that for each sample one injection can be analyzed within the incubation time of the first sample.
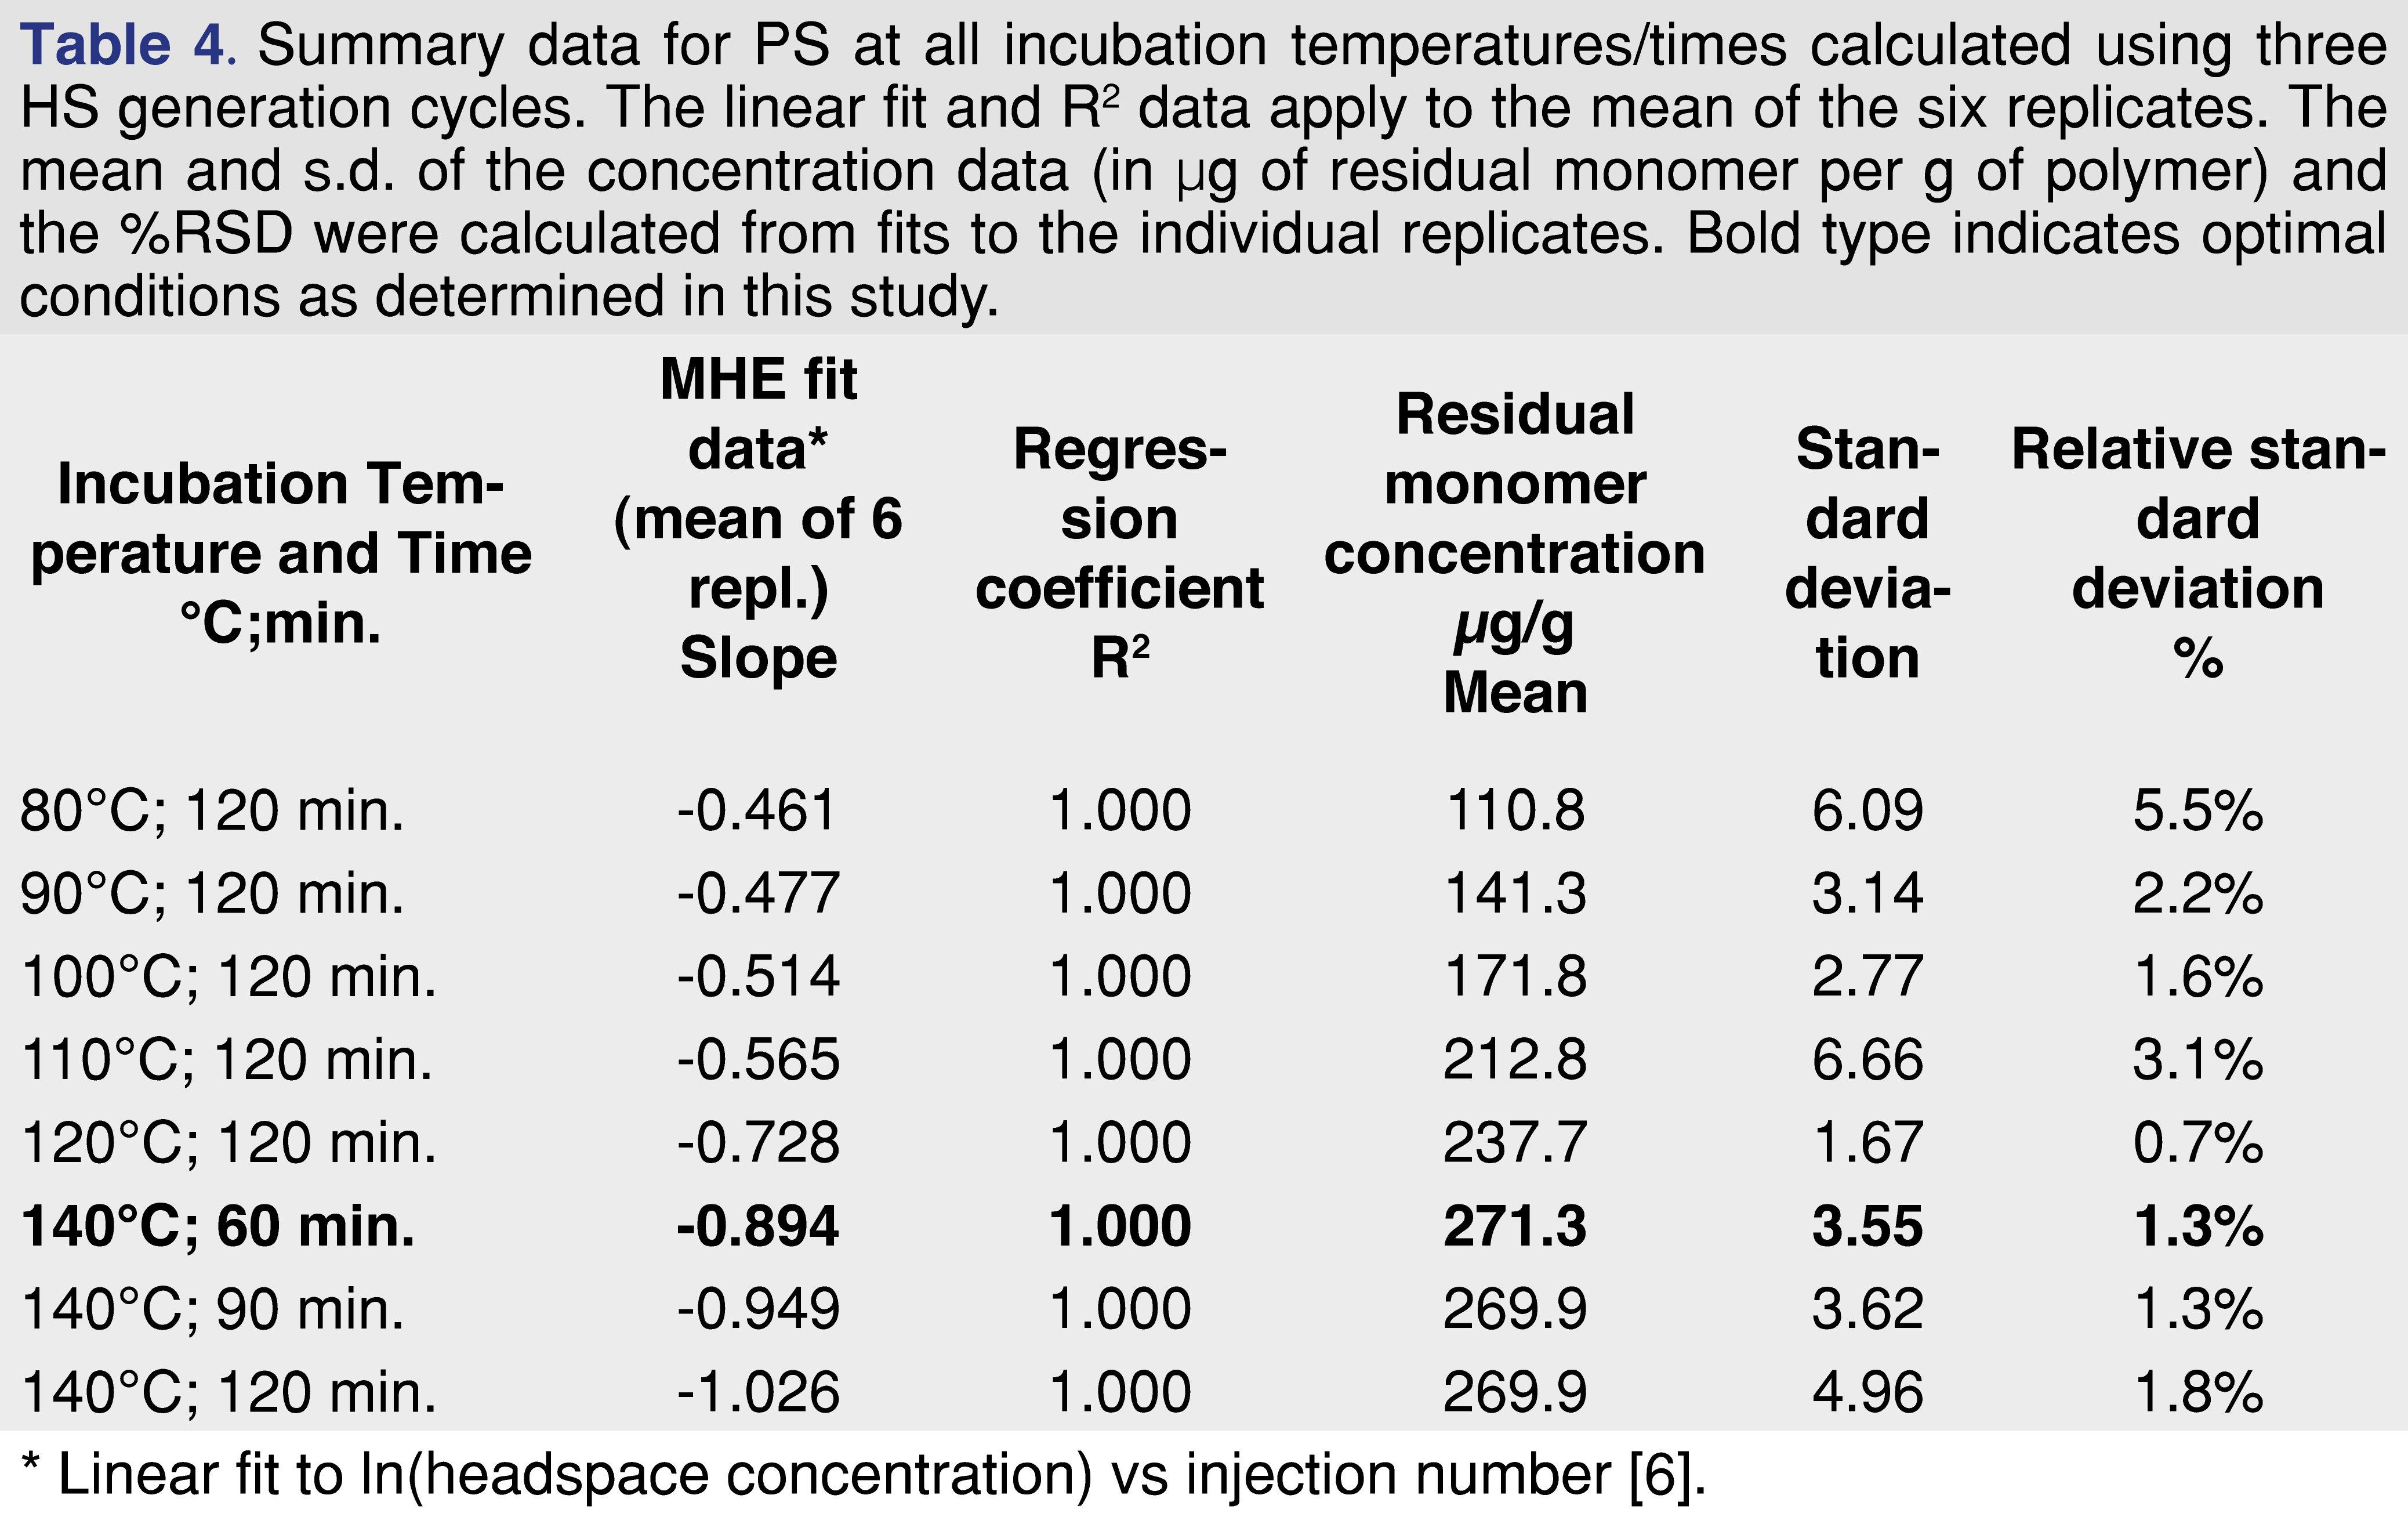
Second, do six headspace generation cycles need to be used in routine analysis? If the results of MHE are highly repeatable, then the number of cycles can be reduced [5,6]. Table 2 demonstrates that MHE-SIFT-MS measurements are very repeatable over six cycles (<2%RSD under all conditions). In Table 4, the data have been recalculated using only the first three points. At lower incubation temperatures, the accuracy (determined from comparison of the mean concentrations) and %RSD are significantly degraded, whereas at 140°C concentration results agree well within 1 s.d. and RSDs are similar. Since the agreement at 140°C for all three incubation times is excellent, this approach enables sample throughput to nearly double compared to that shown in Figure 9, or an eight-fold throughput increase compared with three-cycle MHE-GC/MS.
Figures and Tables


[Click to enlarge]
4.3. Increased throughput via correlation of MHE with static HS
With MHE-SIFT-MS a more radical approach to quantitation of residual polymers is feasible due to very repeatable HS analysis: calibration of the full MHE approach against the first injection (i.e., the first HS equilibration) and thus deriving the residual monomer concentration from just one HS generation cycle. This approach was evaluated at the optimal incubation temperature (140°C) based on the favorable comparison of three- and six-cycle MHE under these conditions, as demonstrated above. The results are summarized in Table 5. Repeatability of the first HS injection is very similar to that obtained for MHE results fitted over six injections. Hence from the mean of the six replicates, a calibration factor was determined. Use of this approach is justified insofar as all experimental conditions for the single injection remain identical to those used in the MHE method. The calibration factor should be determined from six replicate MHE samples, not a single run.
In principle, adoption of the single-cycle approach enables quantitative analysis of residual monomer at a throughput of 12 samples per hour, or ca. 250 samples per day, plus blanks, calibrations standards and quality control checks [10,11]. However, this approach would constitute a significant departure from the conventional routine analysis approach because batches for MHE analysis can differ. Therefore, the recommended approach for SIFT-MS follows the conventional strategy, in which the first sample of a batch is run using MHE (effectively a quality control check for the batch), followed by a single HS generation/analysis cycle for the other replicates in the batch. This approach is illustrated in Figure 8(c), with the constraint of a 12-replicate batch imposed by the 12-position virtual incubator. For the conditions used here, this approach sees the advantage of SIFT-MS over GC/MS diminished to some extent because the SIFT-MS instrument sits idle about half the time (the six- and three-cycle MHE-SIFT-MS approaches were more highly optimized). Nevertheless, SIFT-MS still provides over twice the throughput of GC/MS, at ca. 84 samples per day.
4.4. MHE-SIFT-MS: Scope of Application
This article has demonstrated that MHE-SIFT-MS is readily applied to PS, which – with a Tg of 100°C and no sensitivity to hydrolysis (at least under the conditions used here) – provides an essentially ideal case study. Here, some considerations related to wider application are discussed.
First, it is recognized that there are polymers with more challenging physicochemical properties. Approaches for two examples (polyoxymethylene (POM), which has a Tg of 30°C and a propensity for decomposition into formaldehyde, and polybutylene terephthalate (PBT), which starts to hydrolyze in the presence of moisture above its Tg (65°C)) will be addressed in part two of this study. For these polymers, and others like them, sample preparation requires additional care, and the protocol described here requires additional tuning.
Second, the linearity range of SIFT-MS and how it relates to MHE needs to be considered. Successful MHE requires that the HS concentration decays nearly three orders of magnitude through the six HS generation cycles (see the 140 °C plots in Figure 6) to obtain the best fit to the data. Since SIFT-MS has a linearity range of ca. five orders of magnitude [16], it readily accommodates measurement of the full decay without any requirement for dilution of early injections or enrichment of late injections if the optimal quantity of polymer is utilized. The magnitude of the signal arising from the first injection will, however, be dependent on the product being tested (identity, grade) and its physical properties (surface area, shape, minimum migration dimension). Therefore, the recommended approach is to conduct an experiment that varies the optimal quantity of polymer once equilibration times have been determined. Alternatively, the data from the equilibration study can be used to guide the decision on quantity leading into the MHE study (while ensuring that reagent ion signal is not saturated).
Third, MHE-SIFT-MS utilizes targeted analysis. Although untargeted screening of polymers has been described [20], the reduced precision of an untargeted full-scan-based analysis (coupled with data reprocessing to extract concentration data [23]) means that it is not compatible with MHE because additional noise is introduced at later injections when headspace concentrations are low. Instead, the recommended approach for more complex systems is (i) identification of the most significant volatiles (using SIFT-MS and/or other techniques, such as GC/MS), and (ii) development of a SIFT-MS analytical method that targets multiple compounds using a selected ion monitoring (SIM) mode approach. Using this strategy, C1 to C10 aldehydes – and three other low molecular weight oxygenates – were analyzed simultaneously in paperboard using MHE [26]. The ca. 60-s injection time available for automated HS-SIFT-MS provides sufficient time for analysis of multiple compounds with high precision across the dynamic range required for MHE.
Finally, since SIFT-MS is a DIMS technique (in which sample is continuously being delivered to the reaction region – a flow tube in SIFT-MS), the user must consider the reactivity of the entire HS to ensure that the instrument is operating within its linear range. For MHE-SIFT-MS studies on food- and pharmaceutical-grade polymers, in general, the residual monomer itself will dominate the headspace, and so can be used to ensure that the instrument is operating within its linear range. For lower-grade polymers, HS samples should be analyzed using a full-scan approach to identify the dominant volatiles. If the headspace is dominated by other volatiles (e.g., solvent-type residues), MHE can be rendered unviable. For example, an attempt to conduct MHE-SIFT-MS analysis of soil samples was unsuccessful because it used certified reference materials prepared from a methanolic solution of benzene, toluene, ethylbenzene, and xylene isomers. This contrasts with successful application of methanolic extraction of soil when using static HS-SIFT-MS [27], where the high methanol concentration is more manageable because the target compounds are at relatively low concentrations (i.e., the solvent residue and target compounds are both within the dynamic range of the instrument). In MHE, the initial injection requires higher target compound concentrations, which – when added to the high concentration of residual solvent – takes the instrument outside its dynamic range, and MHE is not viable because the required sensitivity for later injections is not achieved.
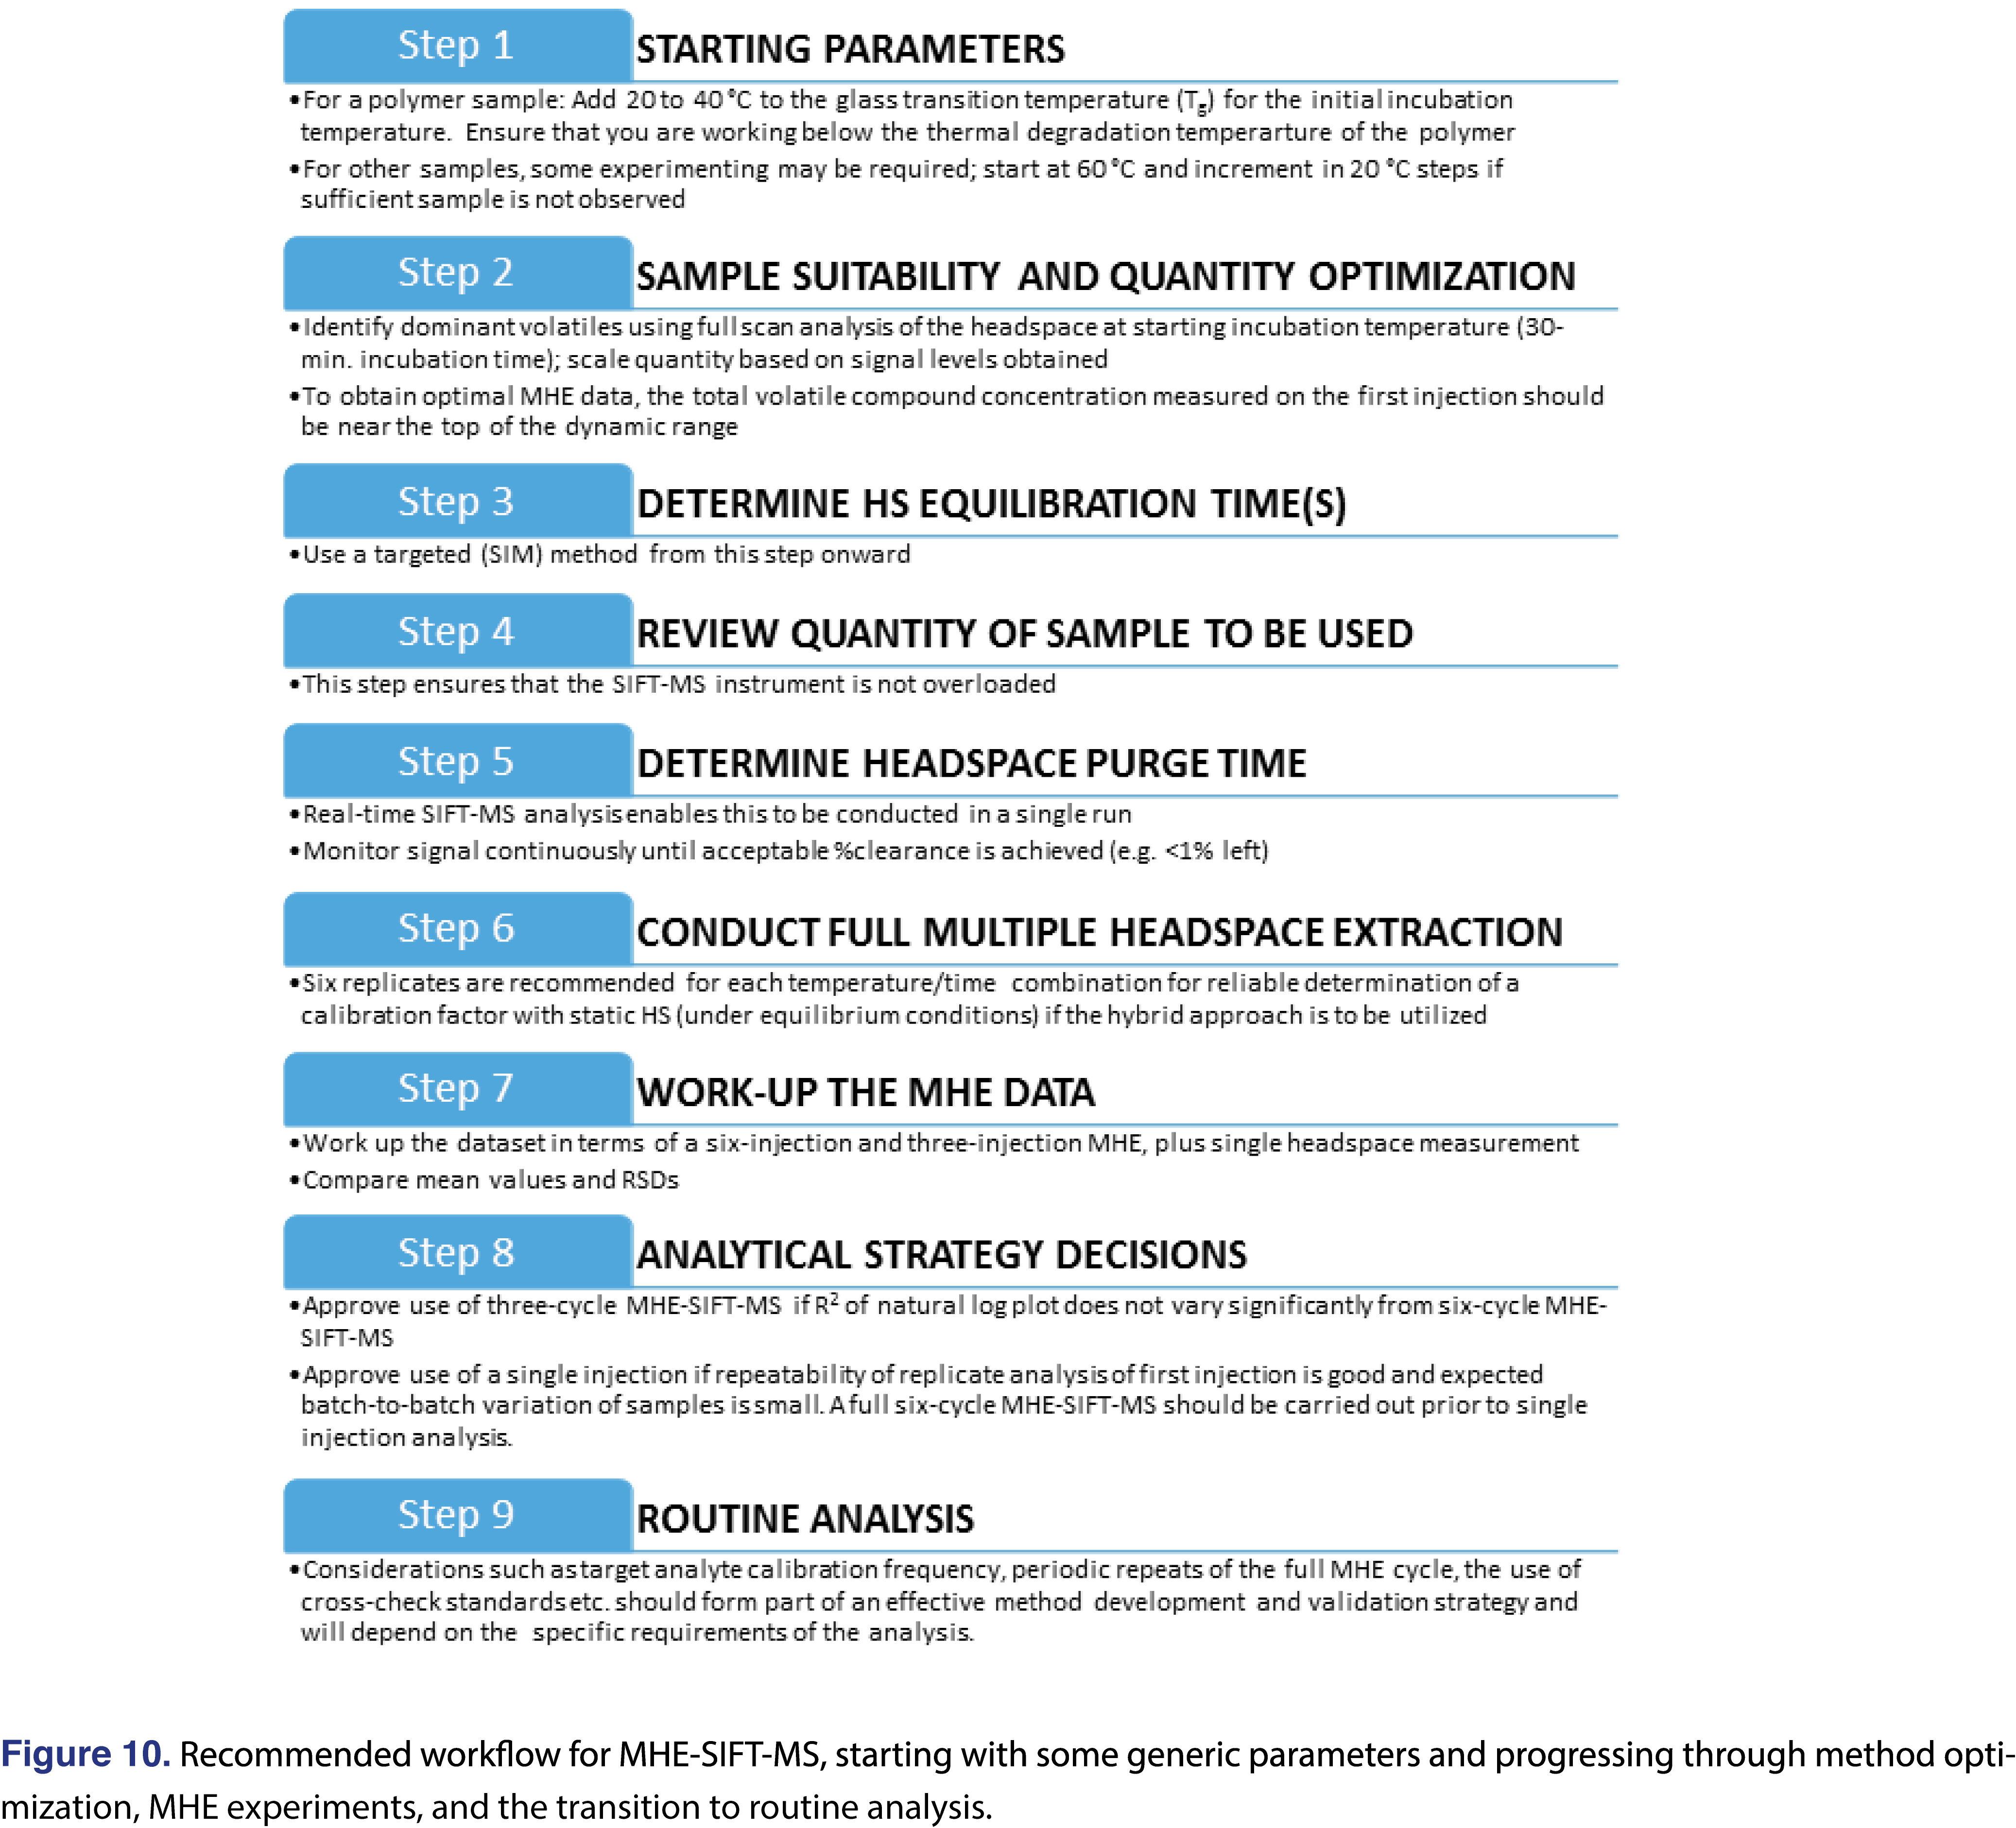
4.5. Recommended Workflow for Routine Analysis
The method development, experimental results, and discussion above enable formulation of a workflow for quantitative, automated MHE-SIFT-MS analysis from method development through to routine analysis. This workflow is summarized in Figure 10.
5.0. Conclusion
MHE is a matrix-independent technique for determination of VOC content without the need to determine partition coefficients or prepare standards in matrices where it is difficult to do so. This study has demonstrated that the MHE technique for quantitative determination of volatile compounds is compatible with SIFT-MS. In the case of PS, for a particle size of 250 µm with an optimal incubation temperature of 140 °C and incubation time of 60 min., with appropriate automation hardware MHE-SIFT-MS provides an eight-fold sample throughput increase compared to conventional MHE-GC/MS. This is due to the rapid analysis provided by direct injection MS and optimized sample scheduling. MHE-SIFT-MS provides highly repeatable determination of residual styrene content, with RSDs better than 2% under all conditions investigated.
Linear fits with R2 > 0.999 at 140°C, together with high repeatability, enabled the full six-cycle HS generation approach to be reduced to three cycles, yielding identical results (within measurement uncertainty) to the full MHE approach. The net effect was almost double the sample throughput. The more radical approach of correlating full MHE with the first injection was also evaluated, where a calibration factor between the two is determined enabling quantitative residual monomer determination from a single HS equilibration to be made without the requirement to determine partitioning. Based on the high repeatability of the first injection, this approach can be used in routine analysis provided that the HS is generated under identical conditions to MHE and regular MHE is conducted as a quality control check for the first sample in each batch. The calibration factor should be reevaluated on a weekly basis through measurement of at least six replicate samples over six HS generation cycles. In routine analysis, utilization of a single injection provides a five-fold throughput increase over GC/MS.
The scope of MHE-SIFT-MS application appears to be quite wide but will be limited to targeted analysis. The utilization of direct soft chemical ionization [11] and the elimination of the chromatographic column, means that analysis of residual chromatographically challenging volatile compounds is simplified. This will be demonstrated in part two of this study using MHE measurement of formaldehyde emissions from polyoxymethylene (POM). The wide linear range of SIFT-MS is of benefit for MHE analysis, but care must be taken to ensure that – due to the removal of the chromatographic column – other matrix compounds do not saturate the instrument’s reagent ion signal. This means that – in contrast to GC/MS – procedures analyzing solutions in organic solvents or matrices spiked using solvents may not be transferable to SIFT-MS. Nevertheless, for appropriate matrices, MHE-SIFT-MS and its correlated single-injection HS measurement can provide faster quantitative analysis, potentially supporting enhanced quality assurance and quality control systems.
6.0 References
- Food and Drug Administration (United States Government). Guidance for Industry: Container Closure Systems for Packaging Human Drugs and Biologics (1999). Accessed October 6, 2021. Available at https://www.fda.gov/media/70788/download
- Norwood DL, Stults CLM, Nagao LM, Ball DJ (Eds). Leachables and Extractables Handbook: Safety Evaluation, Qualification, and Best Practices Applied to Inhalation Drug Products, John Wiley & Sons, New York, USA (2012).
- Arvanitoyannis IS, Bosnea L. Migration of substances from food packaging materials to foods. Crit Rev Food Sci Nutrition 44, 63-76 (2004). https://doi.org/10.1080/10408690490424621
- European Food Safety Authority. Opinion of the scientific panel on food additives, flavourings, processing aids and materials in contact with food (AFC) on: Guidelines on submission of a dossier for safety evaluation by the EFSA of a recycling process to produce recycled plastics intended to be used for manufacture of materials and articles in contact with food. The EFSA Journal. 717, 1-12 (2008).
- Kolb B, Pospisil P, Auer M. Quantitative headspace analysis of solid samples; a classification of various sample types. Chromatographia 19, 113-122 (1984). https://doi.org/10.1007/BF02687726
- Kolb B, Ettre LS. Theory and practice of multiple headspace extraction. Chromatographia 32, 505-513 (1991). https://doi.org/10.1007/BF02327895
- Kolb B, Ettre LS. Static Headspace-Gas Chromatography – Theory and Practice (2nd ed.), John Wiley & Sons, New York, USA (2006). https://doi.org/10.1002/0471914584
- Shen W, Wang W, Firor R. Multiple headspace extraction for the quantitative determination of residual monomer and solvents in polystyrene pellets using the Agilent 7697A Headspace Sampler, Agilent Technologies Application Note (2012). Accessed September 13, 2021. Available at https://www.agilent.com/cs/library/applications/5991-0974EN.pdf
- McEwan MJ. Direct analysis mass spectrometry, in: Ion Molecule Attachment Reactions: Mass Spectrometry, T. Fujii (Ed.), Springer, New York, USA, 263-317 (2015). https://doi.org/10.1007/978-1-4899-7588-1_8
- Perkins MJ, Langford VS. Standard validation protocol for selected ion flow tube mass spectrometry methods applied to direct headspace analysis of aqueous volatile organic compounds. Anal Chem, in press.
- Perkins MJ, Langford VS. Application of routine analysis procedures to a direct mass spectrometry technique: Selected ion flow tube mass spectrometry. Rev Sep Sci 3(2), e21003 (2021). https://doi.org/10.17145/rss.21.003
- Perkins MJ, Padayachee D, Langford VS, McEwan MJ. High throughput residual solvent and residual monomer analysis using selected ion flow tube mass spectrometry. Chromatogr Today 10(3), 2-5 (2017).
- Mark JE. Polymer Data Handbook (2nd Ed.), Oxford University Press, New York, USA (2009).
- Smith D, ŠSpanel P. Selected ion flow tube mass spectrometry (SIFT‐MS) for on‐line trace gas analysis. Mass Spectrom Rev 24, 661‐700 (2005). https://doi.org/10.1002/mas.20033
- Smith D, McEwan MJ, ŠSpanel P. Understanding gas phase ion chemistry is the key to reliable selected ion flow tube-mass spectrometry analyses. Anal Chem 92, 12750-12762 (2020). https://doi.org/10.1021/acs.analchem.0c03050
- Prince BJ, Milligan DB, McEwan MJ. Application of [SIFT-MS] to real-time atmospheric monitoring. Rapid Commun Mass Spectrom 24, 1763-1769 (2010). https://doi.org/10.1002/rcm.4574
- Hera D, Langford VS, McEwan MJ, McKellar TI, Milligan DB, Negative reagent ions for real time detection using SIFT-MS. Environments 4, 16 (2017). https://doi.org/10.3390/environments4010016
- Perkins M. Automated selected ion flow tube mass spectrometry (SIFT-MS). Anatune Limited Application Note AS-191 (2017). Available at https://anatune.co.uk/application-notes/automated-sift-ms-system-selected-ion-flow-tube-mass-spectrometry-sift-ms/
- Syft Technologies Limited. Compound library. LabSyft Software package version 1.8.1 (2020).
- Perkins MJ, Langford VS. Untargeted SIFT-MS headspace analysis: High-throughput differentiation of virgin and recycled polyethylene pellets. Mass Spec. 2022, In Press. https://doi.org/10.1002/rcm.9230
- Perkins MJ, Padayachee D, Langford VS. Rapid classification of parmesan using untargeted SIFT-MS headspace analysis. Syft Technologies Application Note APN-064 (2021). Available at .
- Perkins MJ, Padayachee D, Langford VS. Rapid classification of beer using untargeted SIFT-MS headspace analysis. Syft Technologies Application Note APN-065 (2021). Available at .
- Langford VS, Du Bruyn C, Padayachee D. An evaluation of selected ion flow tube mass spectrometry for rapid instrumental determination of paper type, origin and sensory attributes. Packag Technol Sci 34, 245-260 (2021). https://doi.org/10.1002/pts.2555
- Biba E, Perkins MJ, Langford VS. High-throughput residual solvent analysis using selected ion flow tube mass spectrometry (SIFT-MS). United States Pharmacopeia. Pharmacopeial Forum Stimuli Article. In press. https://www.uspnf.com/pharmacopeial-forum.
- Acree WE Jr, Chickos JS, Phase transition enthalpy measurements of organic and organometallic compounds, in: NIST Chemistry WebBook, NIST Standard Reference Database Number 69, P.J. Linstrom, W.G. Mallard (Eds.), National Institute of Standards and Technology, USA.
- Perkins MJ, Langford VS, Du Bruyn C. Rapid determination of volatile compound content using multiple headspace extraction-SIFT-MS. Syft Technologies Application Note APN-035. (2018) Available at
- Perkins MJ. Methanolic extraction of soils by automated selected ion flow tube mass spectrometry (SIFT-MS). Anatune Application Note AS244 (2021). Available at https://anatune.co.uk/application-notes/automated-sift-ms-methanolic-extraction-of-soils-by-automated-selected-ion-flow-tube-mass-spectrometry-sift-ms/
All site content, except where otherwise noted, is licensed under a Creative Commons Attribution 4.0 License