OPEN-ACCESS PEER-REVIEWED
RESEARCH ARTICLE
Nicole Dunn1, Anna Michelson1, Louis Fleck1, Gyorgy Vas1,2,*
1Trace Organics Analytical Intertek Pharmaceutical Services; 2VasAnalytical.
Reviews in Separation Sciences. Vol.4. No.1. pages e22004 (2022).
Published online 12 November 2022. https://doi.org/10.17145/rss.22.004 | (ISSN 2589-1677).
*Correspondence:
Vas G. . VasAnalytical, 6 Avalon Ct, Flemington, NJ 08822. USA.
Editor: Omnia Ismaiel, Virginia Commonwealth University, Richmond, VA, USA.
Open-access and Copyright:
©2022 Dunn N et al. This article is an open-access article distributed under the terms of the Creative Commons Attribution License (CC-BY) which permits any use, distribution, and reproduction in any medium, provided the original author(s) and source are credited.
Funding/Manuscript writing assistance:
The authors have declared that no funding and writing assistance was utilized in the production of this article.
Competing interest:
The authors are employed by the above-mentioned organizations and have declared that no competing interests exist.
Article history:
Received 08 September 2022, Revised 16 October 2022, Accepted 17 October 2022.
Abstract
Analytical data packages are an essential part of the CMC (Chemistry and Manufacturing Control) section of US FDA (United States Food and Drug Administration) NDA (new drug application) submissions for pharmaceuticals and biologics. In many cases, the biocompatibility assessment for medical devices also requires analytical testing to be performed and reported. Based on the quality of the data presented, the regulatory review team makes an informed decision about the safety of the drug product or the medical device. If the submission is incomplete or does not support the safety assessment of the product, additional data may be required, which often delays product approval. Study sponsors must decide between optimizing the amount and quality of the data in the filing packages to save costs upfront, which may delay the approval process versus taking the more conservative approach of providing detailed information, investing more upfront, and minimizing the risk of delays.
Keywords
Analytical Data Package, Biocompatibility, BP4NTA Study Reporting Tool, E&L, Regulatory Submission.
1.0. Introduction
Analytical testing is a mandatory task of the highly regulated process to market pharmaceuticals and medical products [1,2]. The finished products must meet rigorous quality criteria, and the sponsor of the product must provide evidence for safety and efficacy. Once a product is approved, stringent release testing is required for each batch of the material prior to sale, and sponsors must conduct post-market surveillance for any issues that may be reported.
The pharmaceutical industry employs diverse analytical methods, covering detection requirements from a % level down to ppb or sub-ppb levels, and requiring resources from a “routine QC” set-up to a high-end research laboratory. Standardization of such a diverse landscape is very difficult and may not even be possible. Conventional QC testing is somewhat standardized as the instrumentation used is generally simple, and the methods are validated according to widely accepted industry standards and guidances such as from USP (United States Pharmacopeia) and ICH (International Council for Harmonisation of Technical Requirements for Pharmaceuticals for Human Use). In contrast, some pharmaceutical testing, including investigations, E&L, and biocompatibility testing, require testing tailored to each product and state-of-the-art instrumentation. In these areas, method standardization would be very difficult, however, standardizing the reporting requirements is a reasonable goal that would benefit the industry substantially.
As research progresses, the scientific community identifies more risk factors related to drug and device-related impurities, and regulators try to address those concerns by updating regulations, guidances, or widely recognized standards. This process is lengthy; however, it is a strong evidence and data-based process, with the goal to minimize the unnecessary risk associated with pharmaceutical products or medical devices. There are many examples of this constantly evolving system [3-5], but little progress has been made in standardizing analytical methods in the pharmaceutical industry. The difficulties are directly related to the very nature of pharmaceutical testing. In other regulated fields such as food or environmental monitoring, in most cases the matrices are well defined, the methods are often designed for targeted analytes, [6] and the overall number of potential target matrices is fewer compared to the pharmaceutical and consumer sector. However important to note that recently in environmental and food testing significant effort was made to use “screening-type” non-targeted methods for emerging contaminants such as PFAS (Per- and polyfluoroalkyl substances) [7]. Targeted methods that are well-detailed and often matrix specific have been published and used across multiple laboratories [8]. In the pharmaceutical industry, there is a wide range of finished products and medical devices with diverse matrices, which has a significant impact on the outcome of testing. Even a method targeting a concerning analyte or group of analytes (like nitrosamines) must be evaluated and validated for each product to establish the fit for the intended purpose of use.
Matrix effects are one of the main reasons why “industry standard” general use monographs [9], and even specific compendial analytical methods in the pharmaceutical environment need a rigorous verification process performed by the laboratory prior to implementation. The verification process may include evaluating multiple method performance parameters, such as LOD (limit of detection) or LOQ (limit of quantitation), accuracy, injection precision, and carryover. The recommendation for verification of USP compendial methods is described in USP General Chapter <1226> [10]. In other cases, a USP general chapter (or an informational chapter) is published to provide a scientific framework for testing, leaving every laboratory to develop its own methodology [4,11]. Currently, some of the most challenging aspects of registration testing in the pharmaceutical sector are testing for packaging-related trace impurities (extractables and leachables E&L), and biocompatibility testing of medical devices, which do not have standardized test methods. Multiple recalls have been associated with these issues, and complex methods using non-routine state-of-the-art analytical systems must be developed and implemented to satisfy regulatory agencies [8].
Extractable, leachable, and biocompatibility testing is part of the chemistry-related safety risk assessment package. The goal is to test pharmaceuticals, drug packaging, and medical devices for impurities that patients may be exposed to. In order to do so, products are tested under recommended storage conditions, as well as conditions meant to exaggerate expected patient exposure. Each packaging system and medical device is somewhat unique, from materials of construction to storage, sterilization, and use. This complexity means that a significant portion of testing is looking for analytes with unknown identity and quantity at low levels in complex matrices, which requires careful experimental design, analysis, and data processing. An important part of the process is identifying and quantifying the impurities that are found so that safety evaluations can be included in regulatory filings. A challenge often associated with the identification and quantitation tasks is the limited availability of reference standards, which makes both identification and quantitation difficult. Each laboratory takes different approaches to solve the problem, but many of the approaches involve uniquely designed non-routine analytical methodology, proprietary databases, and significant financial investments, making it difficult to compare the strengths and weaknesses of different strategies.
Recently published E&L related Round Robin studies provide evidence of the testing complexity and the difficulties to interpret and conclude studies. The published studies generated large data sets which compare nontargeted analyses from multiple laboratories. It can be concluded that due to the lack of standardization, the outcome of the studies was different than the original expectations [12-16]. The presented data shows large variation from extraction through detection and the identification of the detected analytes, demonstrating the absolute necessity of some level of standardization, which should include a well-defined study framework for the extraction, analysis, identification, quantitation, and reporting.
To apply a standardized protocol to a relatively small study such as a Round Robin test regime is not a difficult task, and it would guarantee a meaningful outcome of the study, however, to apply the same level of standardization to a diverse industry landscape requires multiple years of data generation and in-depth discussions, involving all stakeholders. Recent efforts to standardized testing by the Extractables Work Group of the BioPhorum Operations Group (BPOG) [17] were published and is a promising start. However, the BPOG protocol is not generally accepted by regulators, and covers only single-use manufacturing systems at a reporting threshold of 0.1 ppm. The most useful part of the BPOG effort is the published reporting template. It is highly practical, as even if a chemical analysis was performed by different laboratories, the data can still be reported in a uniform manner, making a comparison of data sets between laboratories much simpler [18]. A similar idea is found in Chapter 7 of ISO 10993-18 (2020) [4], where the reporting requirements for evaluating medical devices are outlined. The requirements are comprehensive; however, no detail is included in the report format; assuming that based on a loose framework each laboratory can write a detailed report which meets all criteria and allow the regulatory review to be performed in a standardized fashion across different device platforms.
As E&L testing is executed as a research activity, it seems logical to use a reporting tool designed for complex research projects [19,20]. A common reporting template would make the submissions more uniform and therefore the review process would be more effective and consistent. The reporting tool was designed as one of the major objectives for a working group (Benchmarking and Publications for Non-Targeted Analysis Working Group or BP4NTA) formed in 2018 for addressing issues related to using non-targeted analysis methods in analytical testing for environmental, food, and pharmaceutical applications [21]. The reporting tool is comprehensive as it is providing a detailed list of analytical parameters and processes to be reported and it is suitable for scientific publications, providing an excellent framework for data transparency and having the potential to improve the reporting quality for analytical data packages for regulatory submissions. As the report format was designed for reporting analytical studies for scientific publications, additions of relevant criteria listed in international standards and guidance for E&L or biocompatibility testing would be useful [4,22]. In this paper, analytical data packages are evaluated from different laboratories covering multiple drug product forms and medical devices. These reports are evaluated to see how they support the ultimate goal of the regulatory filing, which is to provide evidence of the chemistry-related safety risk associated with the pharmaceutical product, as is stated in ISO 10993-18 Clause 7 [4]. In order to support an assessment, the regulatory review team should receive and review all the evidence, to draw the same conclusion as the sponsor. The “golden rule” in the pharmaceutical and medical device industry is “If It Wasn’t Documented, It Didn’t Happen” [23,24]. For regulatory submissions, if all relevant information is not reported, then reviewers do not know how the testing was executed. These knowledge gaps lead to deficiency letters; therefore, analytical data packages should contain all the necessary information for the testing. A reporting tool that guides what and how to report would be useful.
2.0 Results and Discussion
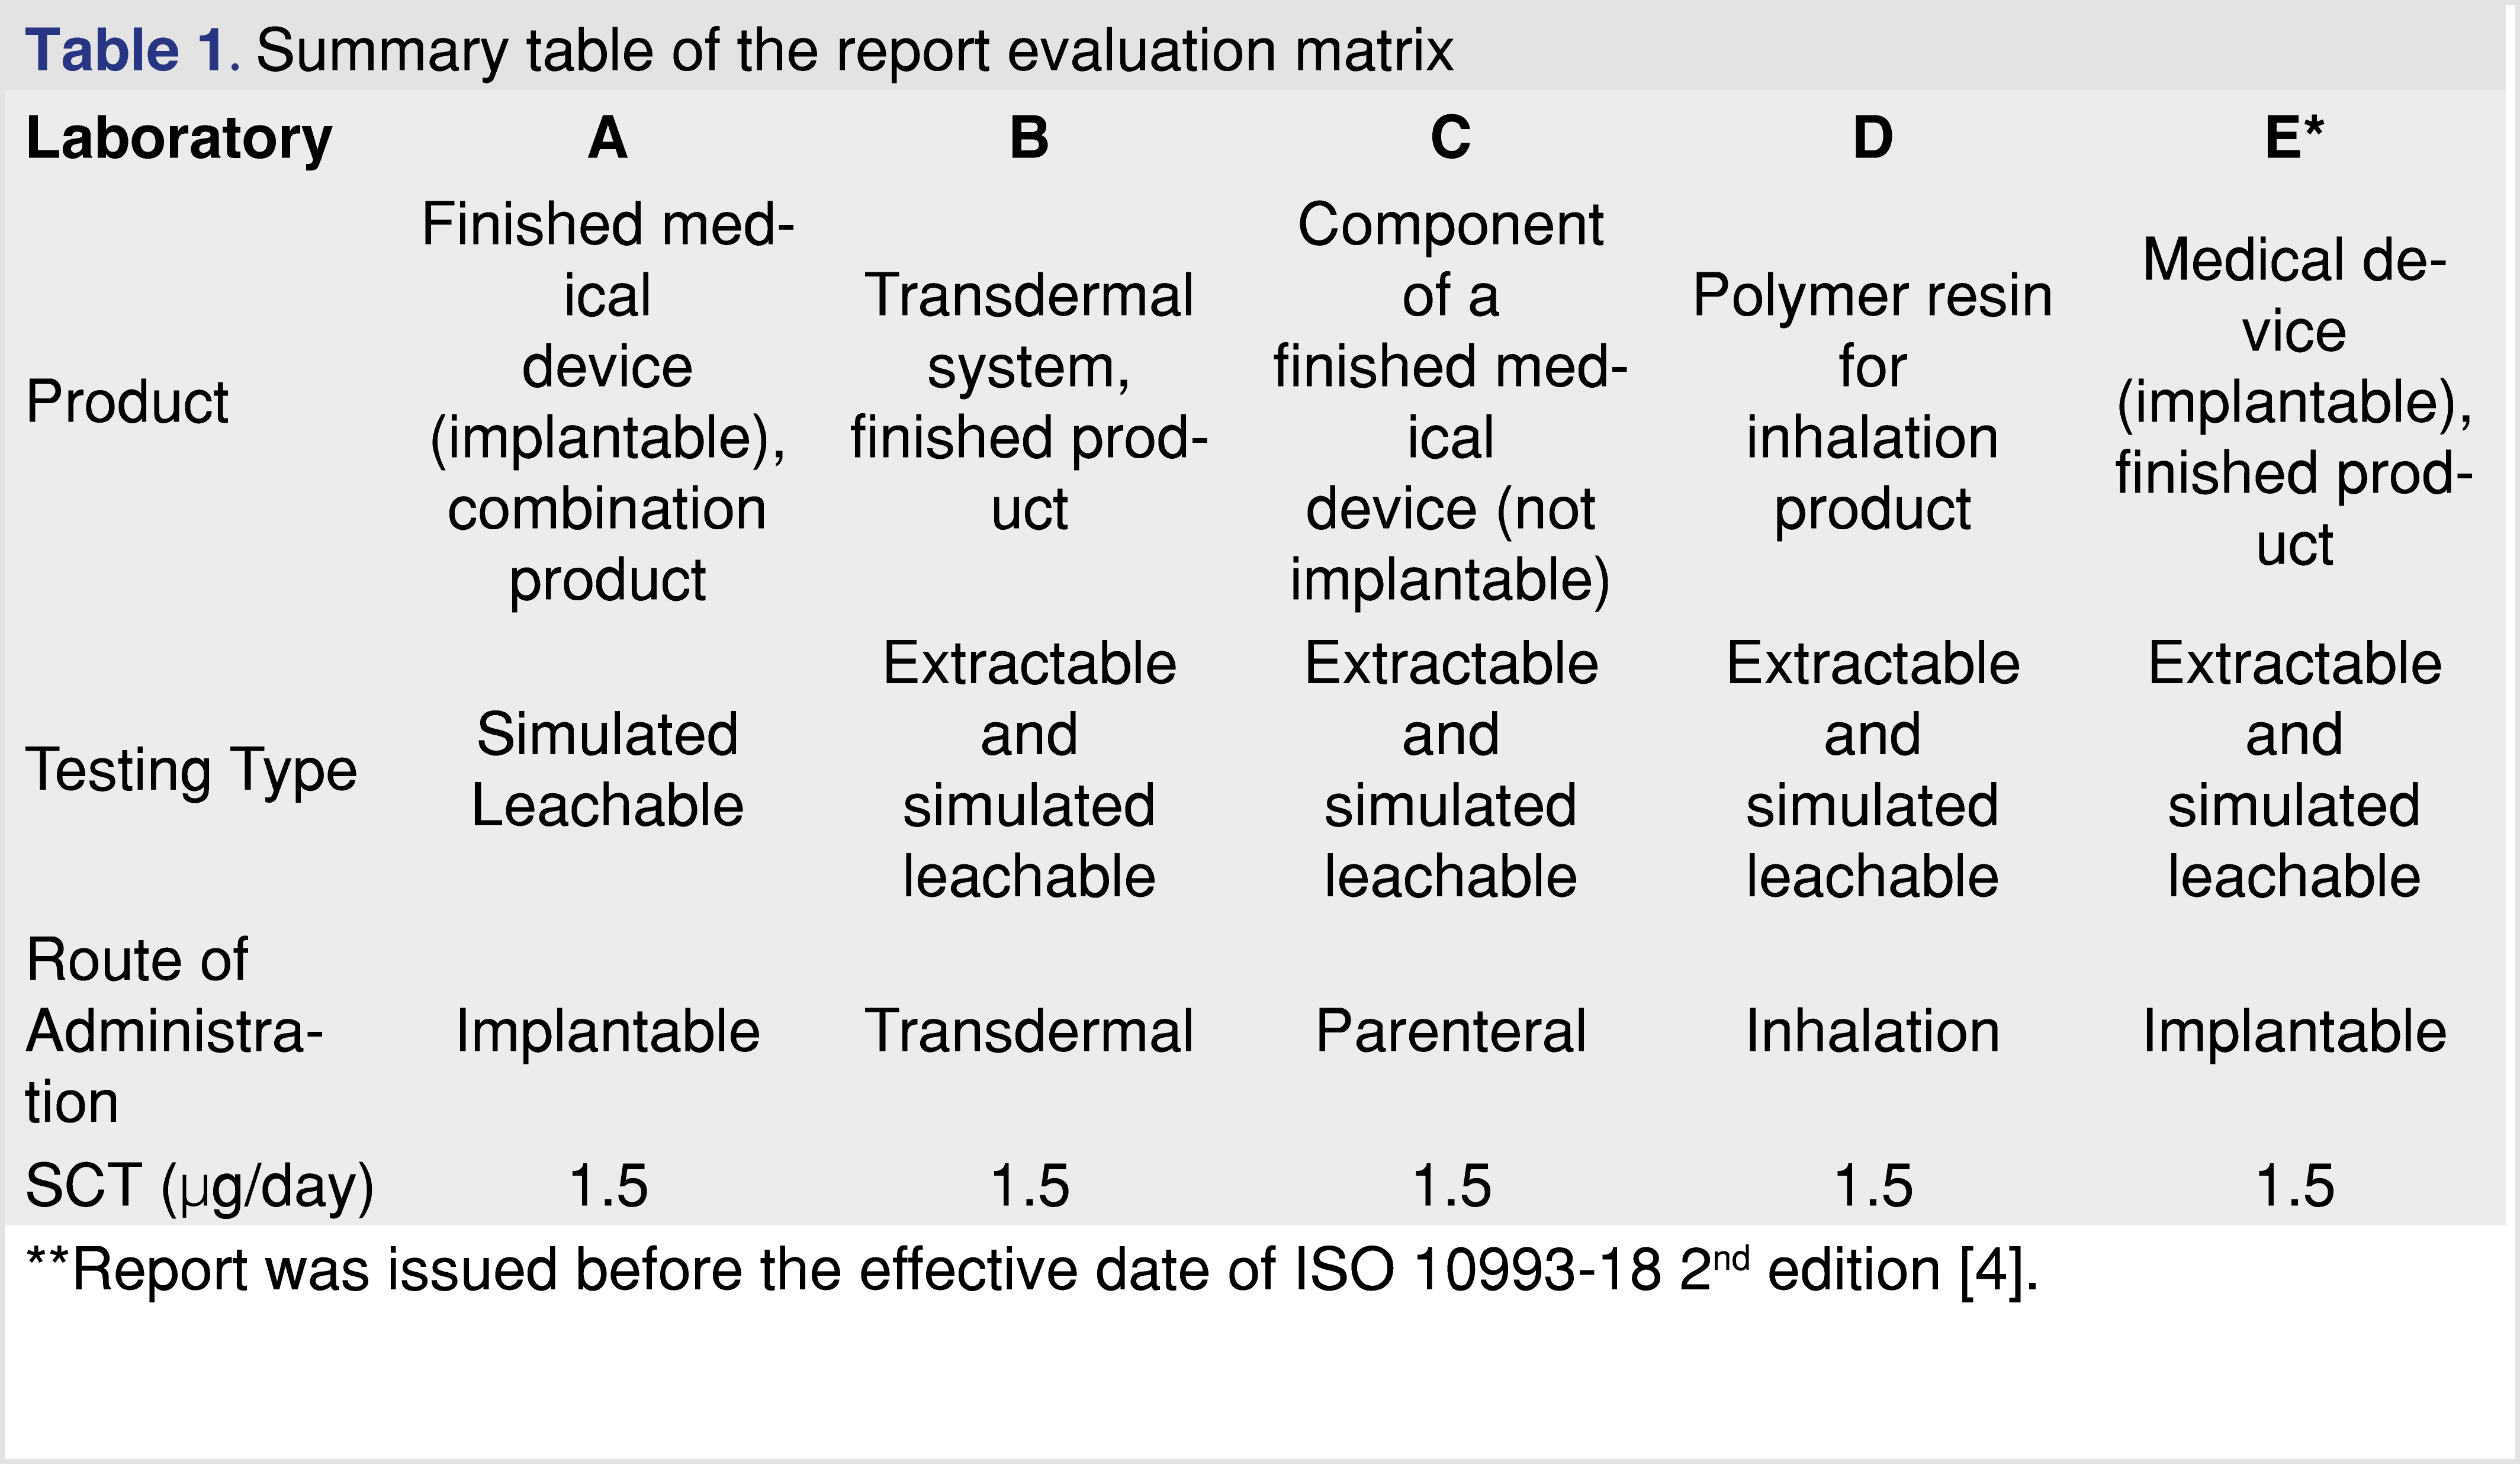
Analytical reports from five different laboratories were evaluated to determine if the laboratory provided sufficient evidence to draw data-based conclusions associated with E&L in the pharmaceutical product or medical device. The identity of the laboratories is not disclosed in this paper, each laboratory was assigned a letter code for identification (A through E), with analytical reports listed in Table 1. To evaluate the analytical reports, the set of reporting requirements published in ISO 10993-18 (Clause 7 and Annex G) [4] was used in addition to the set of reporting criteria published by BP4NTA [20]. To provide a grade for the data presented, a 5-category system was used similar to what was published in the BP4NTA position paper [20], however some of the criteria used for quality grading are not relevant (or difficult to use) for the E&L or biocompatibility assessment, and therefore were not used. The detailed reporting criteria proposed to use for E&L testing are presented in separate tables.
The NTA Study Reporting Tool breaks down the evaluation process into 2 major sections (methods and results), and 5 categories (study design, data acquisition, and data processing in the methods section, data outputs, and QA/QC metrics in the results section). Those categories are further divided into 13 sub-categories and the published study reporting tool provides multiple examples for each category [25]. Most of the categories align with reporting requirements of current published standards, however refining some categories would provide a better fit for E&L and biocompatibility testing. Some of the aspects of pharmaceutical testing are unique, such as cGMP compliance, data integrity, etc.), therefore it may be relevant information to be provided for the regulatory review team as well.
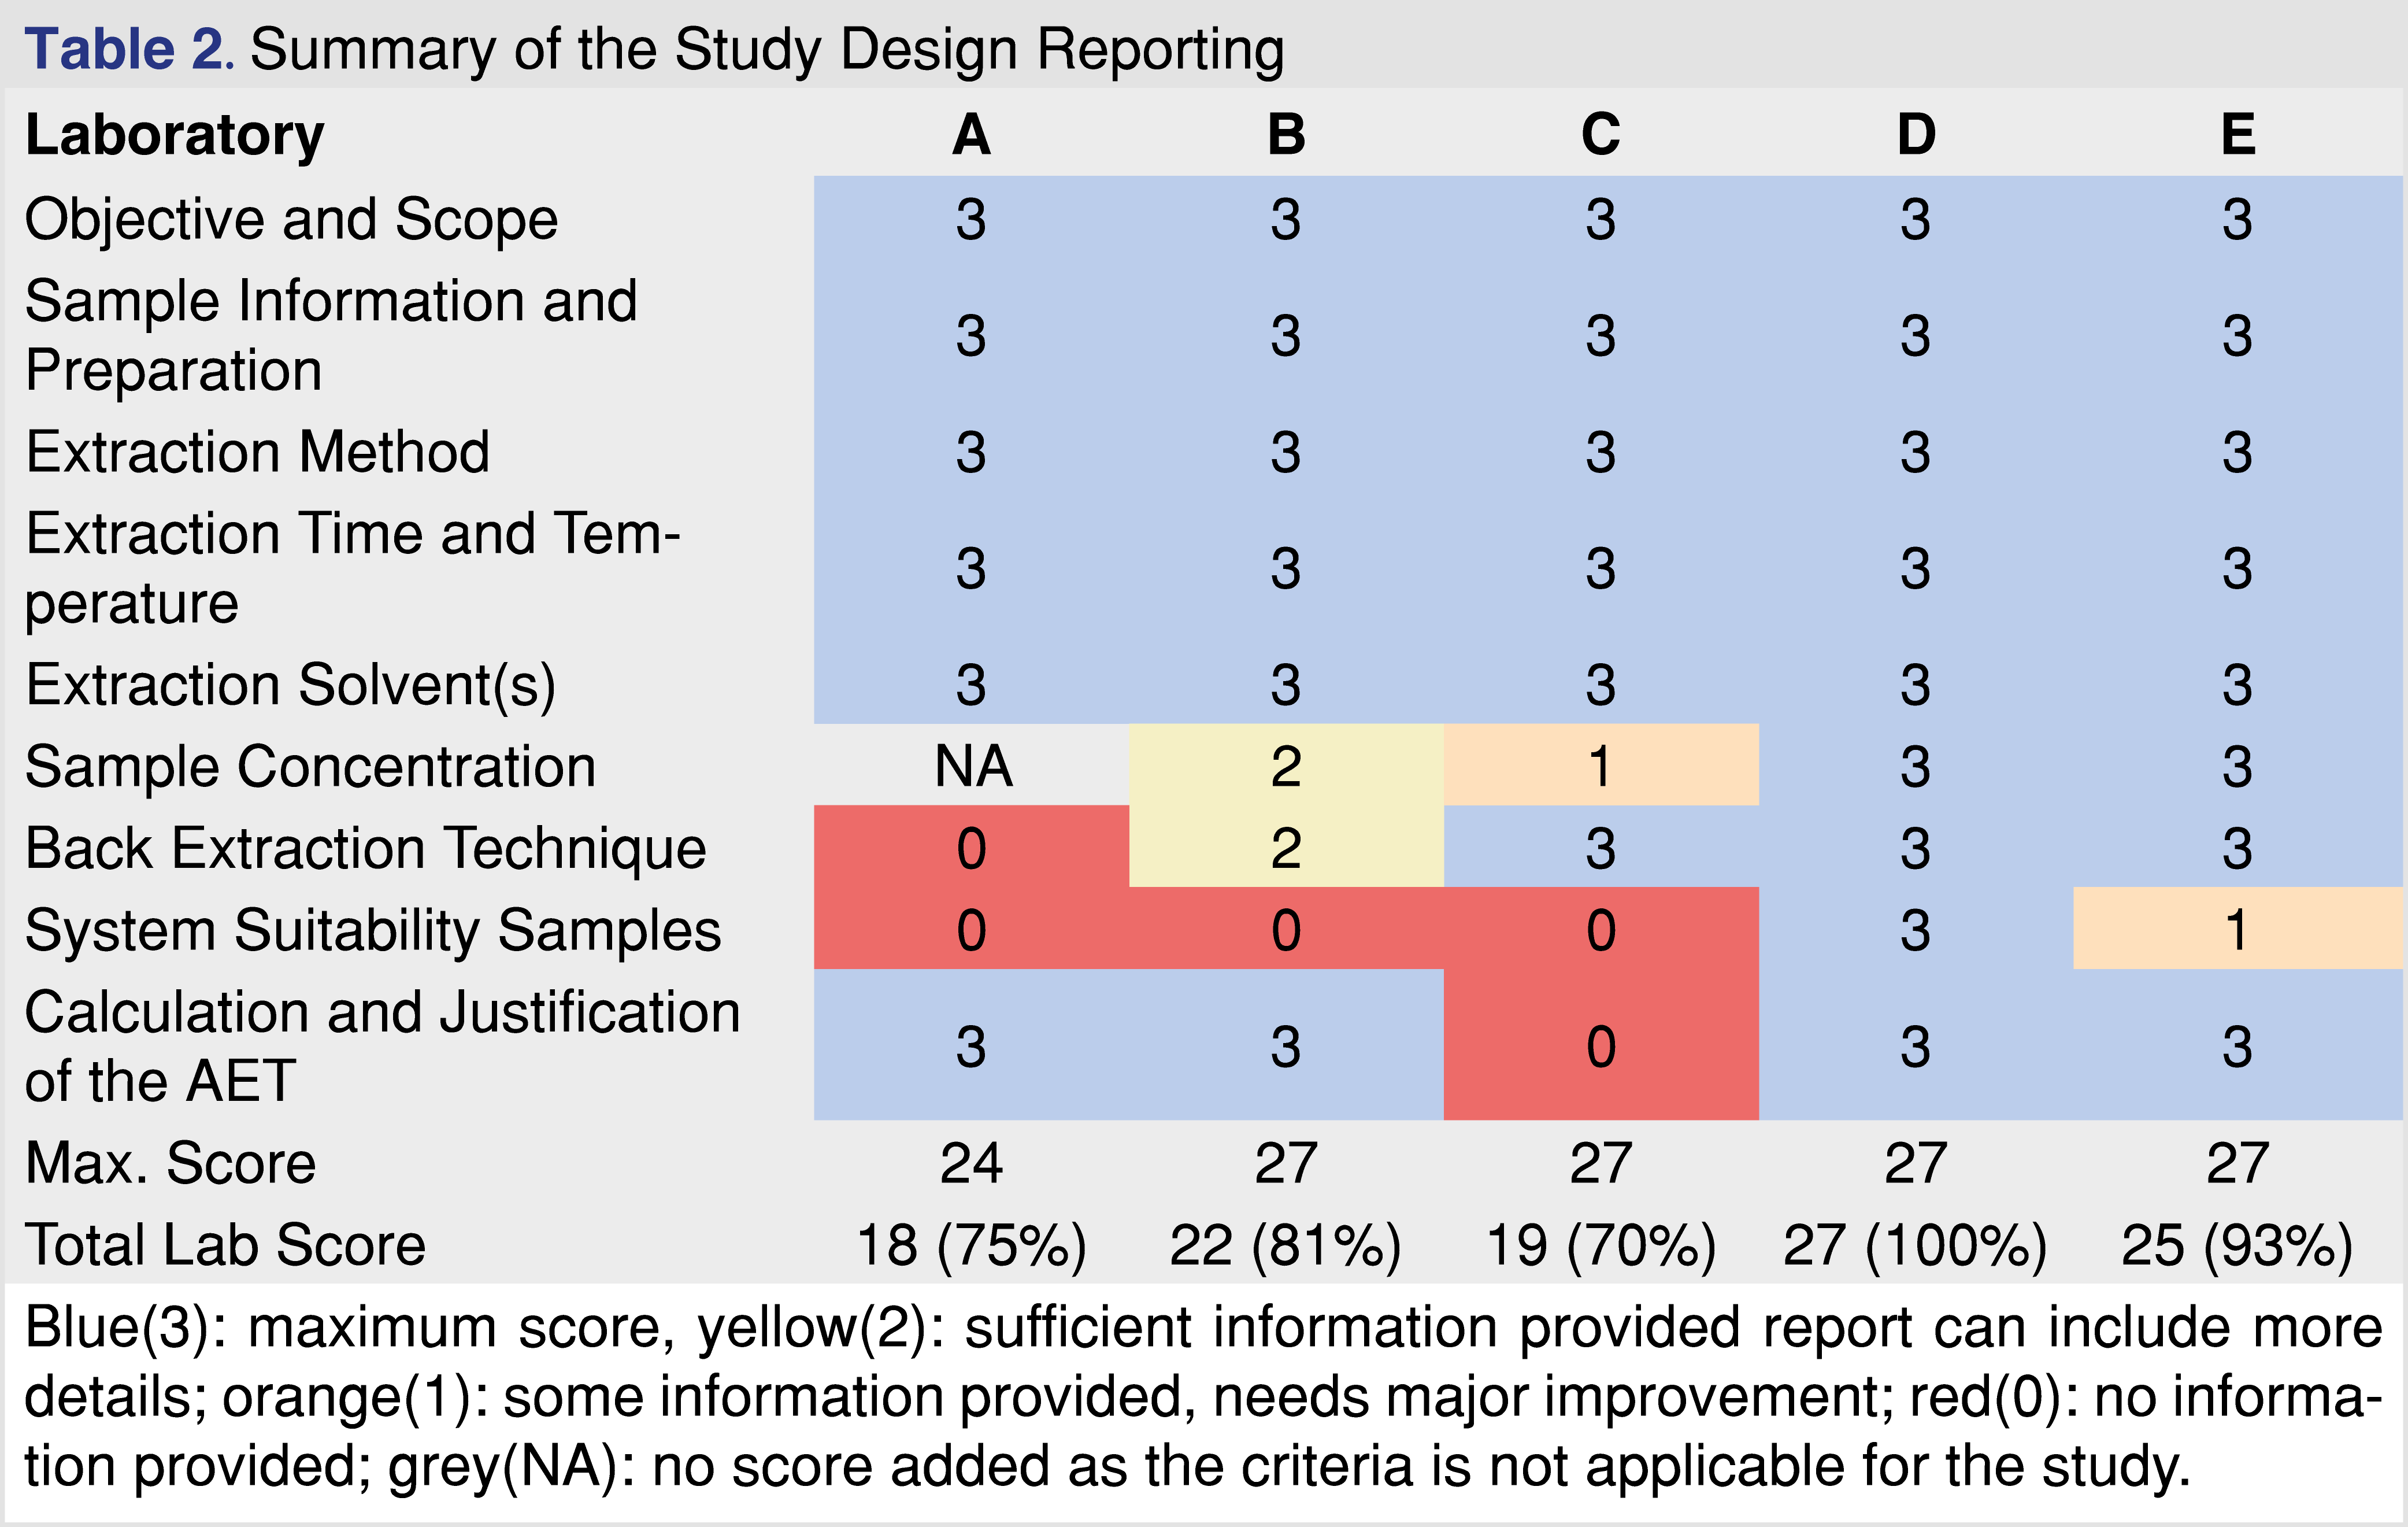
The first major category in the study reporting tool is the study design which was divided into further sub-categories. Sample identification is a critical part of the testing, as regulators expect that the test objects be representative of the marketed product, and sufficient samples should be tested to provide replicates for each batch as well as to capture batch-to-batch repeatability. The summary of the evaluation related to the study design documented in the reports is presented in Table 2. The study design showed the highest evaluation scores among all the evaluated categories. All the reports contained detailed information about the study objective and scope, with clear statements as to why the study was initiated and what type of testing was performed. The selection of samples, blanks, and controls was appropriately documented. The sample preparation is one of the most important parts of E&L testing, as emphasized in standards related to pharmaceutical packaging [11], and biocompatibility testing of medical devices [4]. To have the same emphasis in our proposed tool, the sample preparation was broken down into the following categories: extraction method, extraction parameters, and solvents. All the reports received high scores for study reporting as extraction time and temperature were described and justified, appropriate standards were referenced, and the designs were in compliance with the standards. Pre-concentration of sample extracts was only required prior to the testing if the AET (Analytical Evaluation Threshold) [4] is low, typically below 100 parts-per-billion (ppb); therefore if the AET was above that level, the score is graded as NA. A maximum score of 3 was given to each sub-category if an analyst could reproduce the step based on the report. Justification of why the method was applied was helpful but not required. The AET justification and calculation based on the Safety Concern Threshold (SCT) for pharmaceutical products and Dose-Based Threshold (DBT) for medical devices were present in all of the reports but one. AET is an important part of the E&L and biocompatibility testing, therefore it is recognized in multiple associated regulatory and industry-accepted standards [4,11]. The only sub-category that seemed problematic was the lack of information related to system suitability. It seems logical if the report does not contain any information related to the system’s suitability, the reviewer cannot decide if the system was suitable to generate data at the time of testing or not. The documentation of the system’s suitability along with the acceptance criteria and the performance is a requirement listed in ISO 10993-18 Chapter 7c [4]. Overall, the study design reporting was detailed and comprehensive in every evaluated report.
In the general pharmaceutical testing approach, when a specific target is known and a standard or a justifiable surrogate is available, a targeted method (which can be validated for the target(s)), is used for the testing. This approach is more selective for the targets and usually, the method detection limit is lower compared to the scan-based methods.
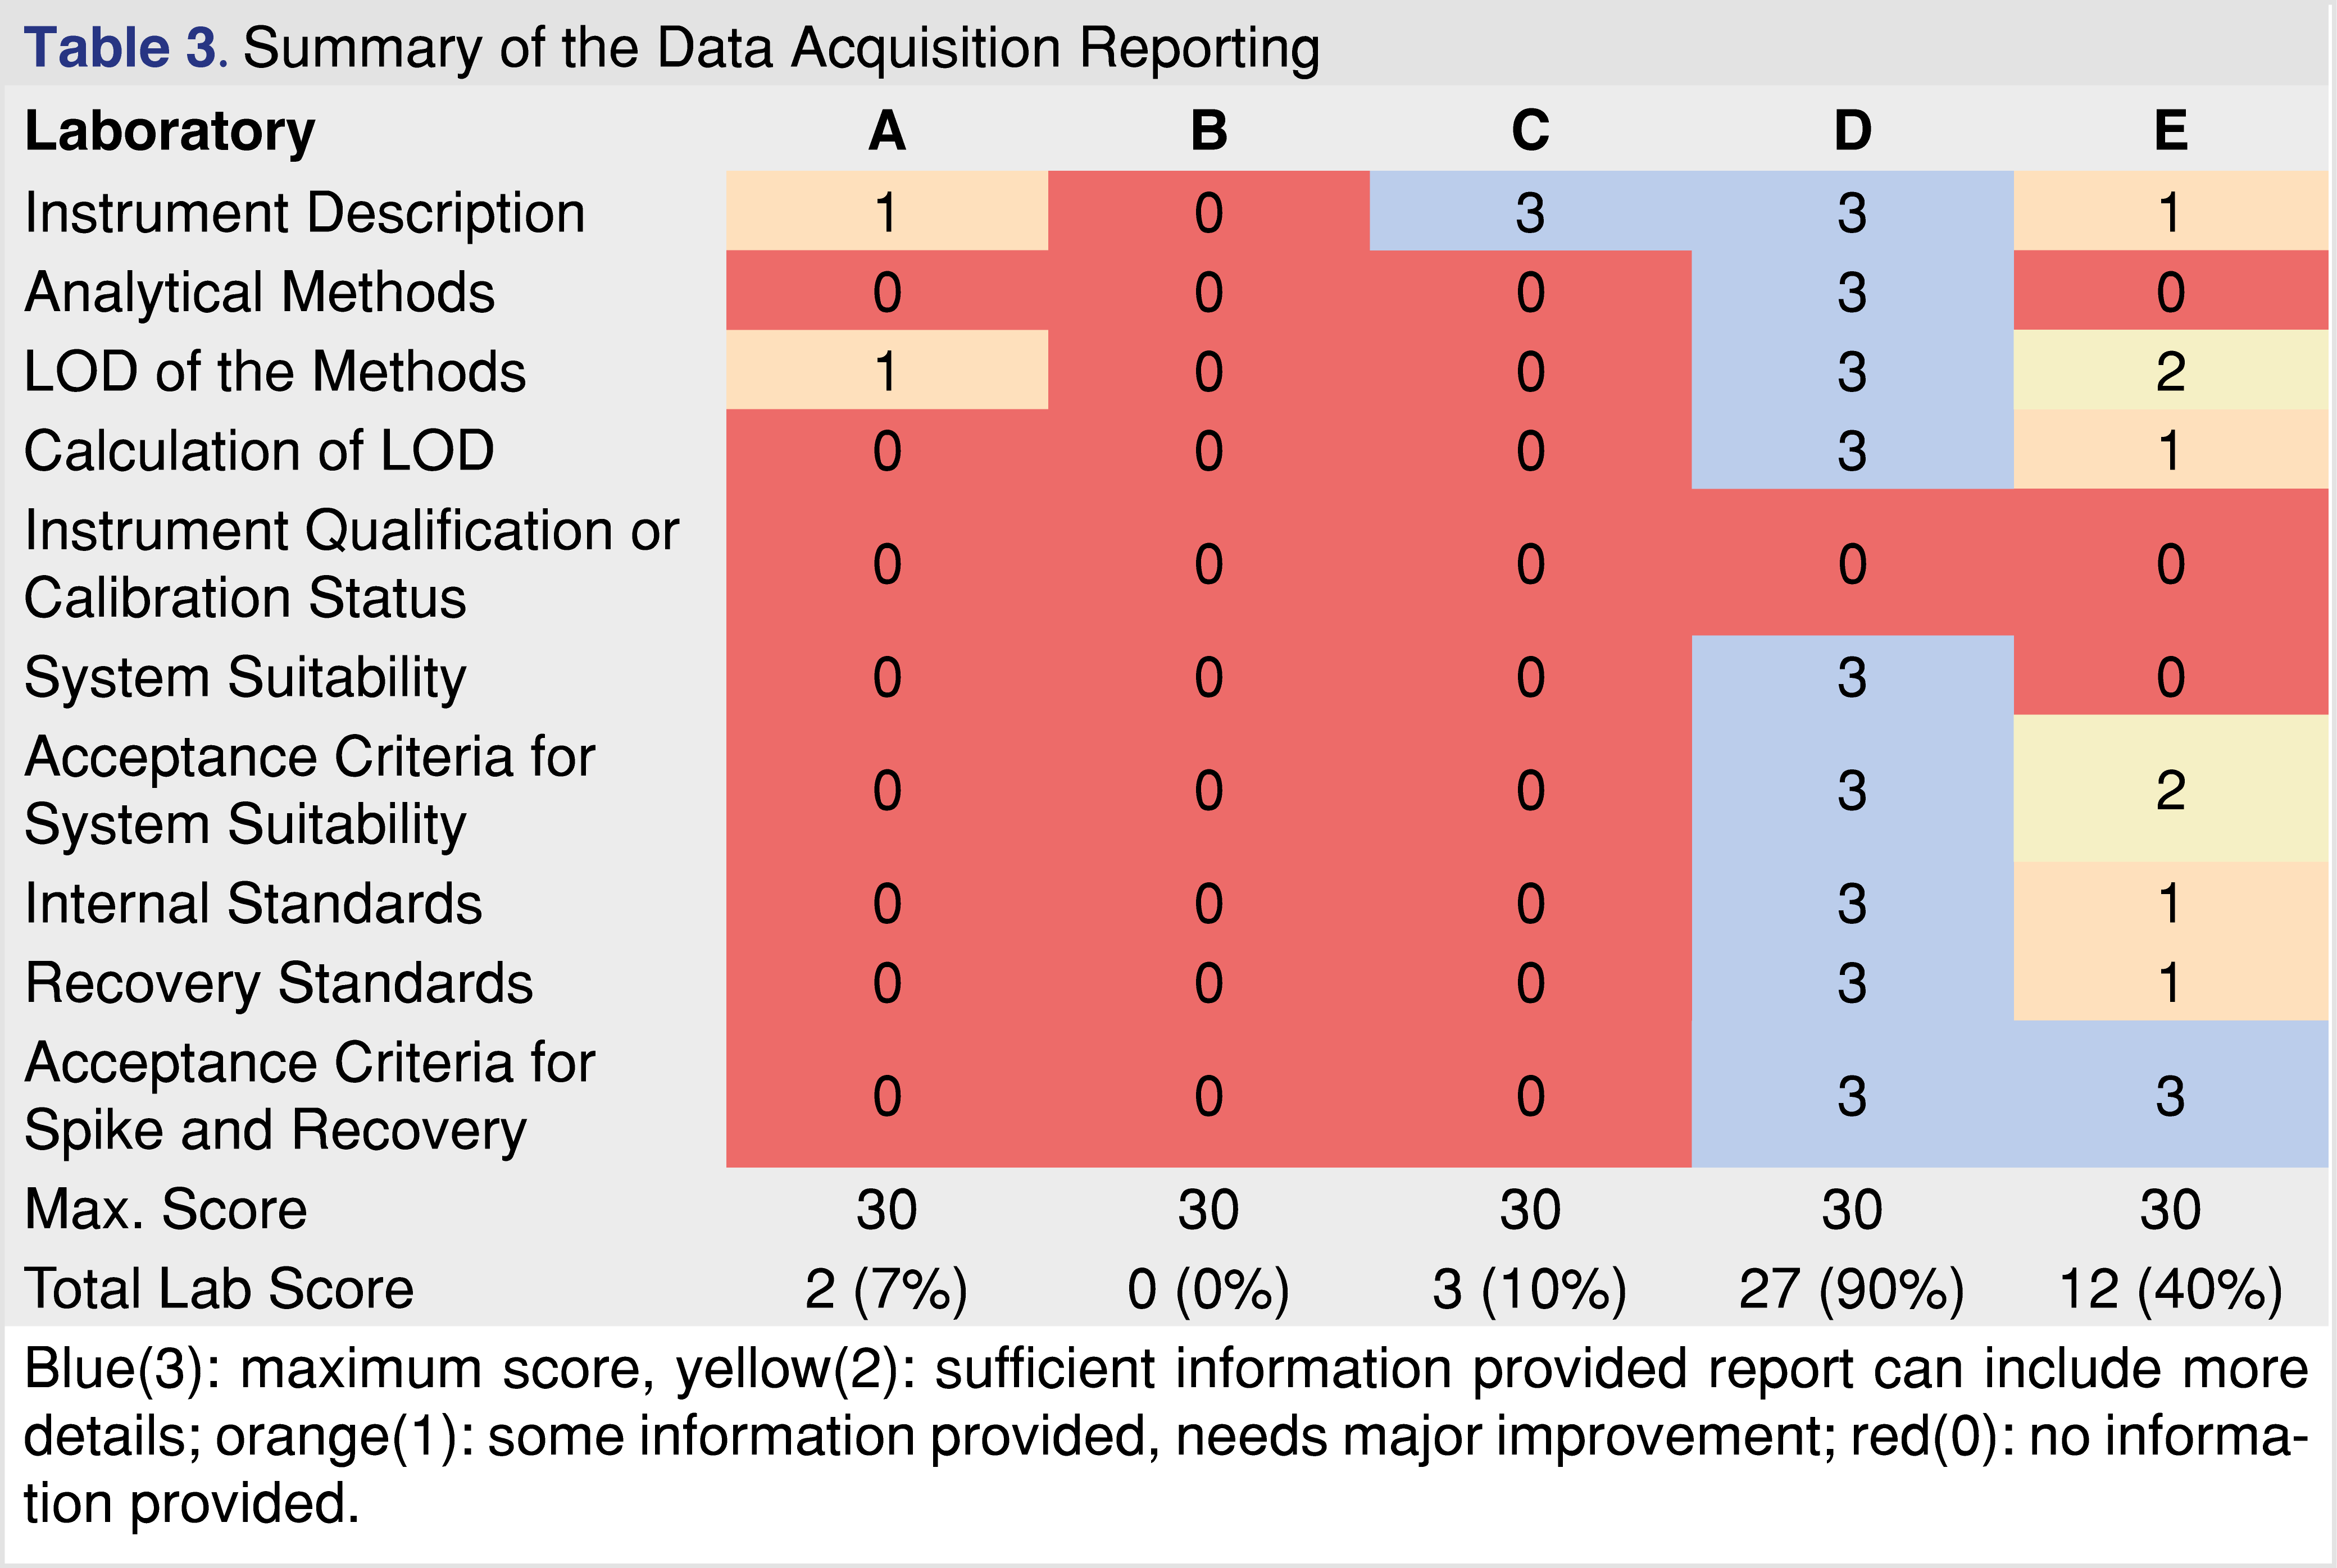
Reporting of the data acquisition parameters was surprisingly inconsistent across the evaluated reports. It is hard to understand why such basic information as a description of the instrumentation and the analytical method was missing or inadequately reported (see Table 3). The information regarding the analytical instrumentation must be reported and justified [22, Attachment E], otherwise, the testing cannot be reproduced, and the reviewer cannot decide if the analytical method or the instrumentation was appropriate for the testing. Two of the reports described the instrumentation properly, two reports described the instrumentation in general terms such “LC-MS” or “GC-MS”, and one report contained no description of the instrumentation. The descriptions of the analytical methods were even more inadequate. It is not necessary to explain why is important to provide details of the chromatographic methods and the detection parameters such as, scan range, resolution etc. The requirement of appropriate documentation of the analytical parameters was published in the draft version of ICH Q14 international guidance document [26].
The introduction of the AET concept to the E&L and biocompatibility testing was a significant milestone [27], which later materialized in industry standards [11,28], and significantly reduced the testing burden for many pharmaceutical products. Before the concept was recognized in industry standards, E&L testing trended towards two extremes: as a multi-year research project where every detected chromatographic peak was investigated, or no peaks were reported and the safety assessment was of questionable worth. To perform suitably at any AET level, the analytical testing methods must have detection limits at least 3-10 fold below the AET, therefore if the AET is 1.5 µg/mL the method LOD (LOQ can be derived from the LOD [29]) should be around 0.15-0.5 µg/mL at a minimum. The LOD needs to be appropriately calculated and reported, as different approaches result in different outcomes [29-31]. Only a single report out of the five reported how the LOD was calculated and without this information, it is hard to decide if LOD was achieved for the testing or not. In addition, when reporting the LOD the laboratory could select a well-responding analyte for the calculation, and therefore the method shows an “artificially low LOD” which is not applicable for a wide range of analytes. For instance, the GC-HS-SPME-MS method LOD for acenaphthene is calculated as 0.02 µg/mL, while the same method has a LOD of 0.2 µg/mL for Tinuvin 327, an order of magnitude difference [31].
None of the reports provided any information on instrument calibration or instrument qualification status. The reader can assume if the laboratory is inspected on a regular basis for compliance as a form of “general compliance audit” by the FDA, the instruments are qualified [32-33], however, regulatory submission reports should be free from assumptions or “guesswork”. E&L testing relies heavily on chromatography systems with mass spectral detection that must be calibrated or tuned on a regular basis. Mass calibration is even more important for high-resolution accurate mass systems (HRAM) since the calculation of the elemental composition is impacted by the mass accuracy of the system.
The other missing parts of those reports were related to reporting activity and outcome of system suitability including acceptance criteria. The CDRH branch of the FDA published final guidance [22] which highlights the importance of system suitability in biocompatibility testing. “FDA recommends that complete test reports be provided for all tests performed because the ISO 10993 series of standards include general methods with multiple options, and in some cases do not include acceptance criteria or address assessment of results.” [22] “Therefore, to support a declaration of conformity, as a part of the supplemental information used to support the use of these standards, we recommend that a rationale for the selected method(s) and protocols be presented with your results so that FDA can assess whether the information obtained will support the biocompatibility of your device.” [22] The importance of the system’s suitability for non-targeted testing is even more important as the laboratory does not know what they are looking for, therefore the performance of the analytical system is critical [34]. Most of the evaluated reports did not document the system’s suitability or provide evidence for the performance status of the instrument used for the testing.
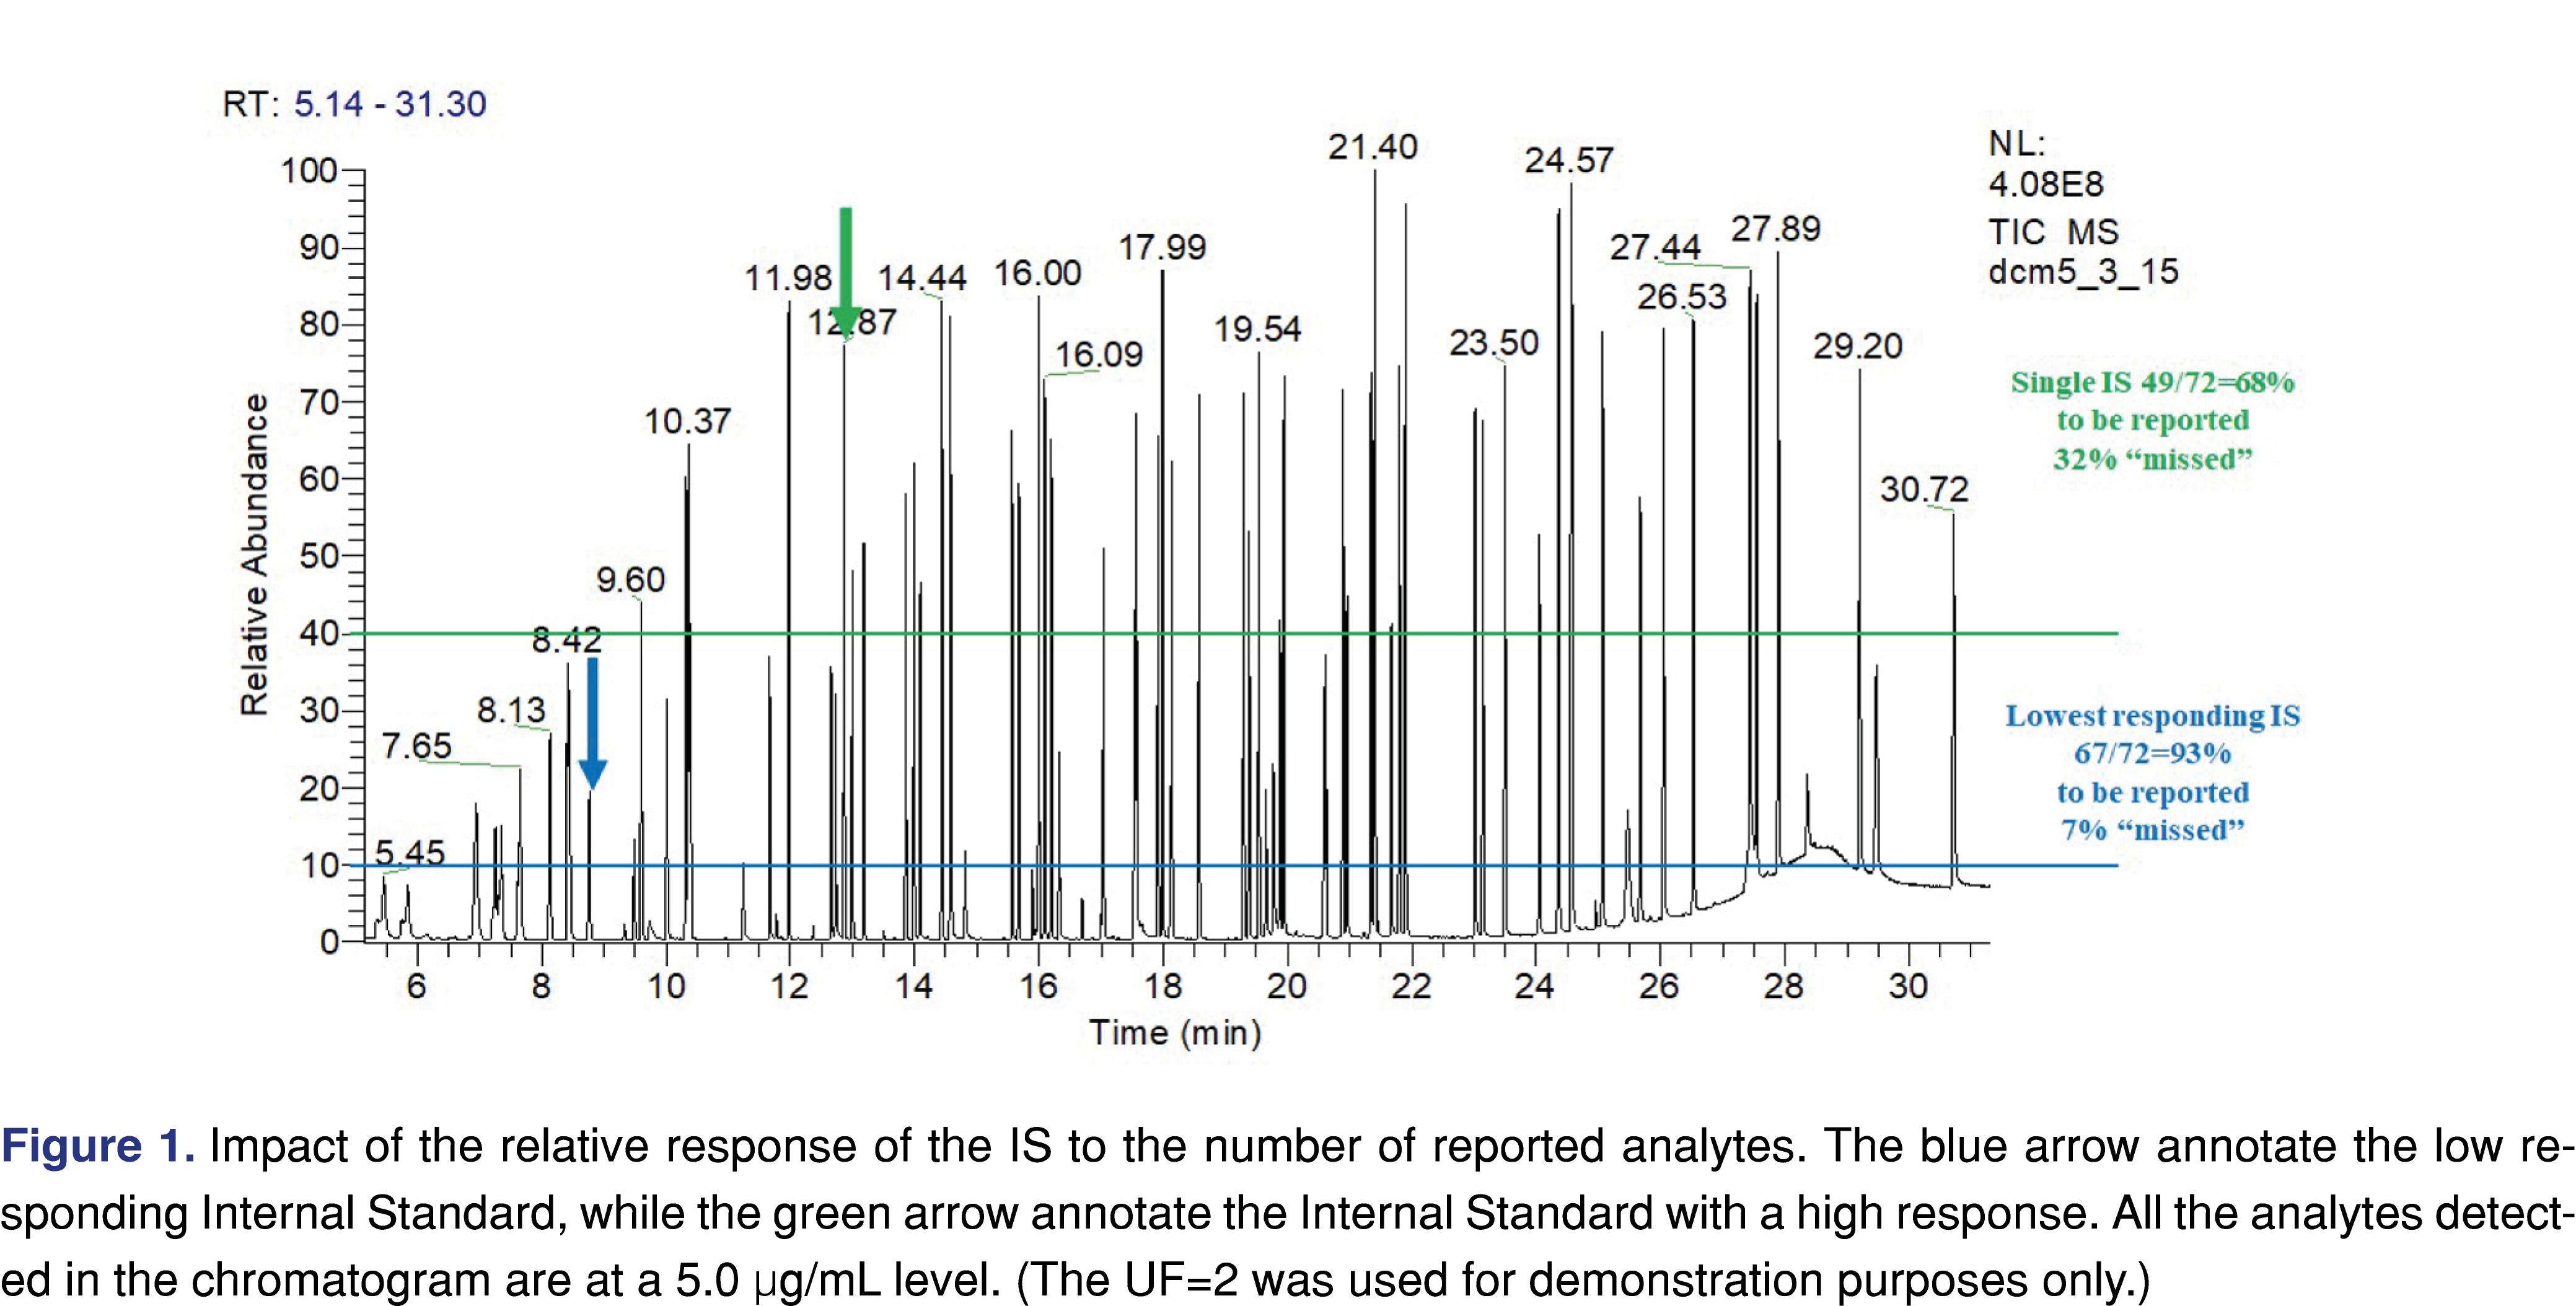
The fourth area of interest was documentation of the use of internal standards (IS), and recovery standards (RS), and providing evidence of acceptance criteria being implemented and justified. The use of IS is an important factor for the whole study, as it is used as an evaluation marker. It can also be used as a reference point for the AET level. The relative response of the IS may have a huge impact on how many peaks are reported and evaluated. Using an analyte with a high response as the IS opens the possibility that low-responding analytes are not being reported, and therefore they will not be further evaluated. The chromatogram in Figure 1 presents two different scenarios, related to a high responding (peak marked with green arrow, associated with horizontal green line) vs. low responding IS (peak marked with blue arrow associated with blue colored horizontal line). A mixture of chemical species with various signal responses was used for the evaluation at 5 µg/mL with multiple IS’s at the same level. The number of the reportable species was calculated based on the different IS’s using an uncertainty factor (UF) of 2. UF is a factor that must be applied to account for the analytical uncertainty of the screening methods used to estimate extractables’ concentrations in an extract. In essence, use of the UF adjusts the AET down to a lower value, ensuring that poorly responding compounds are properly flagged as being at or above the AET and therefore being reportable [4-5]. The calculation method of the UF is based on the relative standard deviation of a response factor database. The equation is provided by PQRI recommendation [27] and ISO 10993-18 (2022) formula E2 [5]. Based on the PQRI recommendation the UF=2 was justified based on a narrow set of data and the fact that this number has been used across the industry for multiple years, even provided in the example calculations of the ISO 10993-18 (example A and C2). It is noted that in certain situations the UF=2 is not appropriate [35-36] (Figure 1).
If a high responding IS was used 23 different species would be non-reported, vs. if a low-responding analyte was used as IS only 5 species would be non-reported. The number and the identity of the IS species used for the analytical study should be reported, and the reviewer can determine if the appropriate IS was used for the testing.
Use of recovery standards is an important aspect of the analytical method when a back extraction technique is applied (aqueous samples for GC-MS testing) or solvent exchange is performed (hexane extracts for reversed-phase LC-MS testing). One of the most typical inconsistencies is related to the inadequate documentation of the spike and recovery. In many cases, it is performed without setting acceptance criteria and the recovery data itself is not provided. Acceptance criteria need to be justified and based on science and best practice. It is important to note that when acceptance criteria for spike and recovery are developed, recovery values for lower analyte concentrations are expected to be lower compared to higher level of analytes. For example, the justifiable recovery at 1 µg/mL target analyte level is 80-110% while at 1 ng/mL level it is 40-120% [37]. It is also important to execute the spike and recovery at the AET level or lower, using a representative range of analytes for the extracts. In summary, based on the evaluation results presented in Table 3, the information presented in these reports does not meet — with one exception — the expectation of the published standards or regulatory guidance. If this is an industry-wide issue, the regulators should make effort to clarify what is expected in submissions.
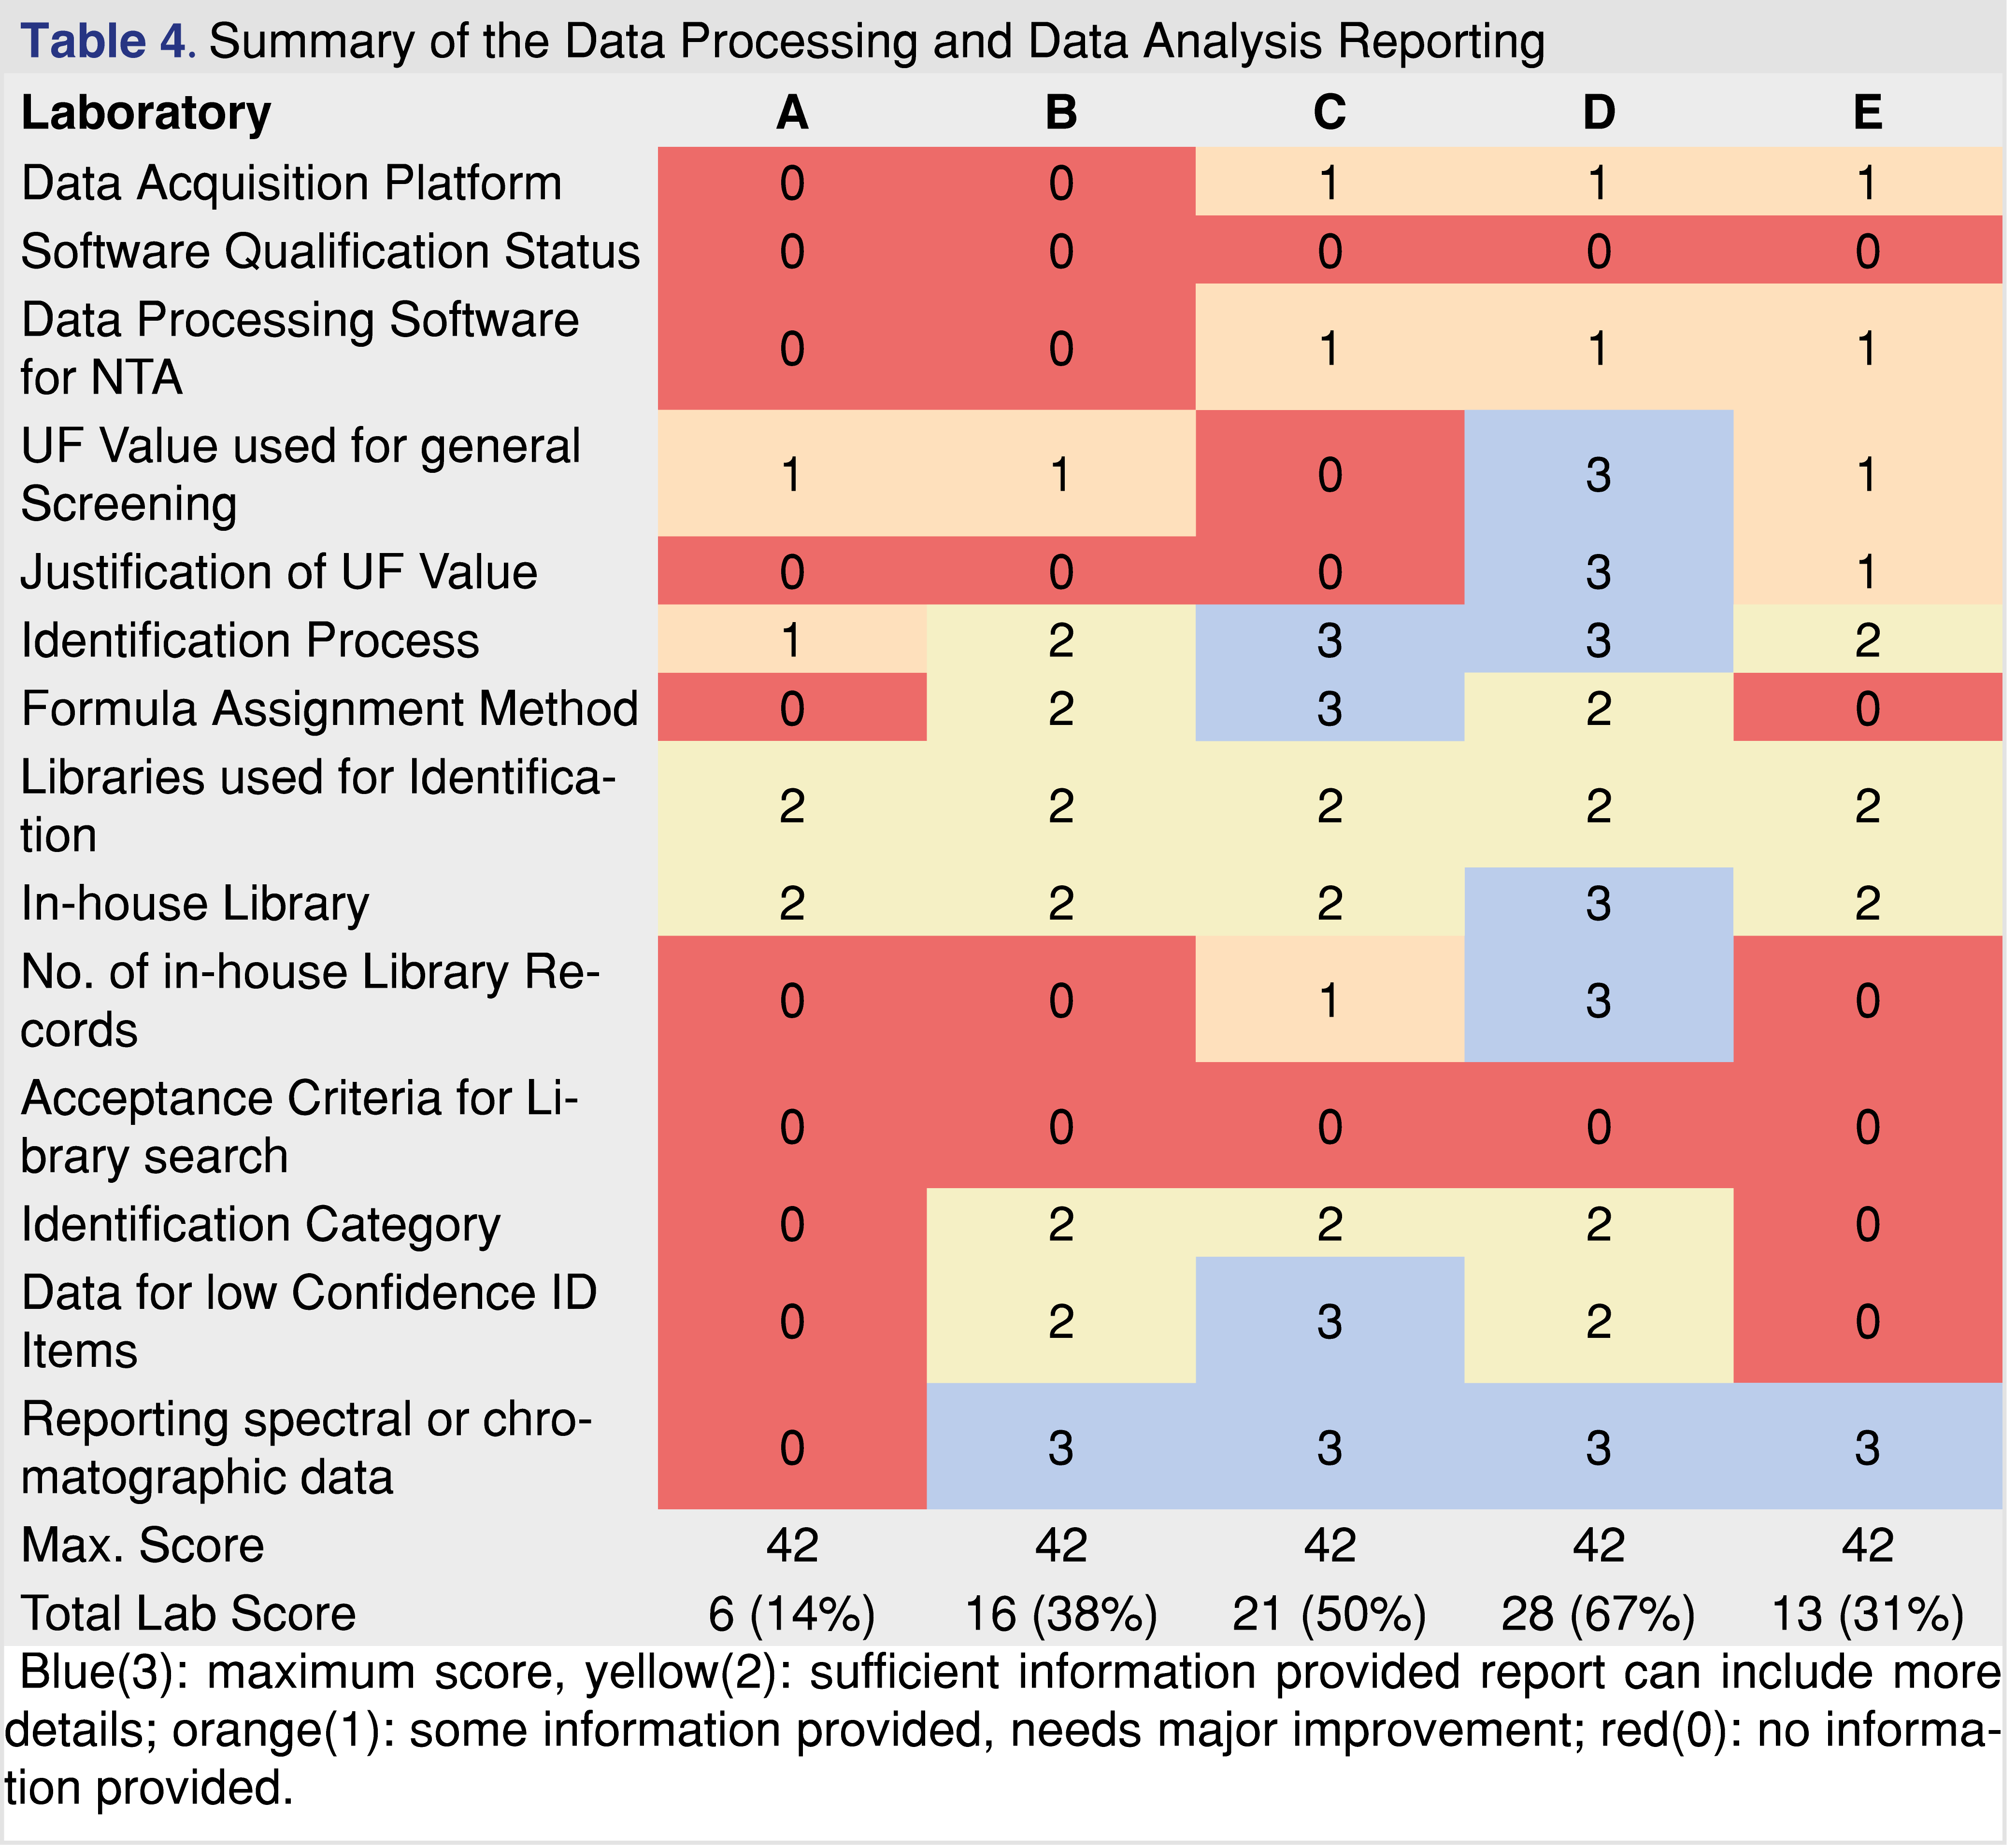
The next category of evaluation is data processing and data analysis. Based on the evaluation data presented in Table 4, this section achieved the 2nd lowest overall score next to the data acquisition section, which has the lowest evaluation scores. The interface between the human operator and analytical hardware is the data acquisition and processing software platform. E&L testing can be executed using two different approaches, as targeted (when the laboratory is looking for known targets) and non-targeted, when the laboratory makes an effort to evaluate every possible chemical species above the study AET. For non-targeted acquisition, the data is acquired in scan mode and the reportable analytes are identified during the data processing step(s). The scan data can also be used to target specific analytes based on their unique mass or unique mass fragments; this approach became a very powerful tool with the use of HRAM instrumentation. Specific targets also can be monitored when a non-targeted method is used for data acquisition.
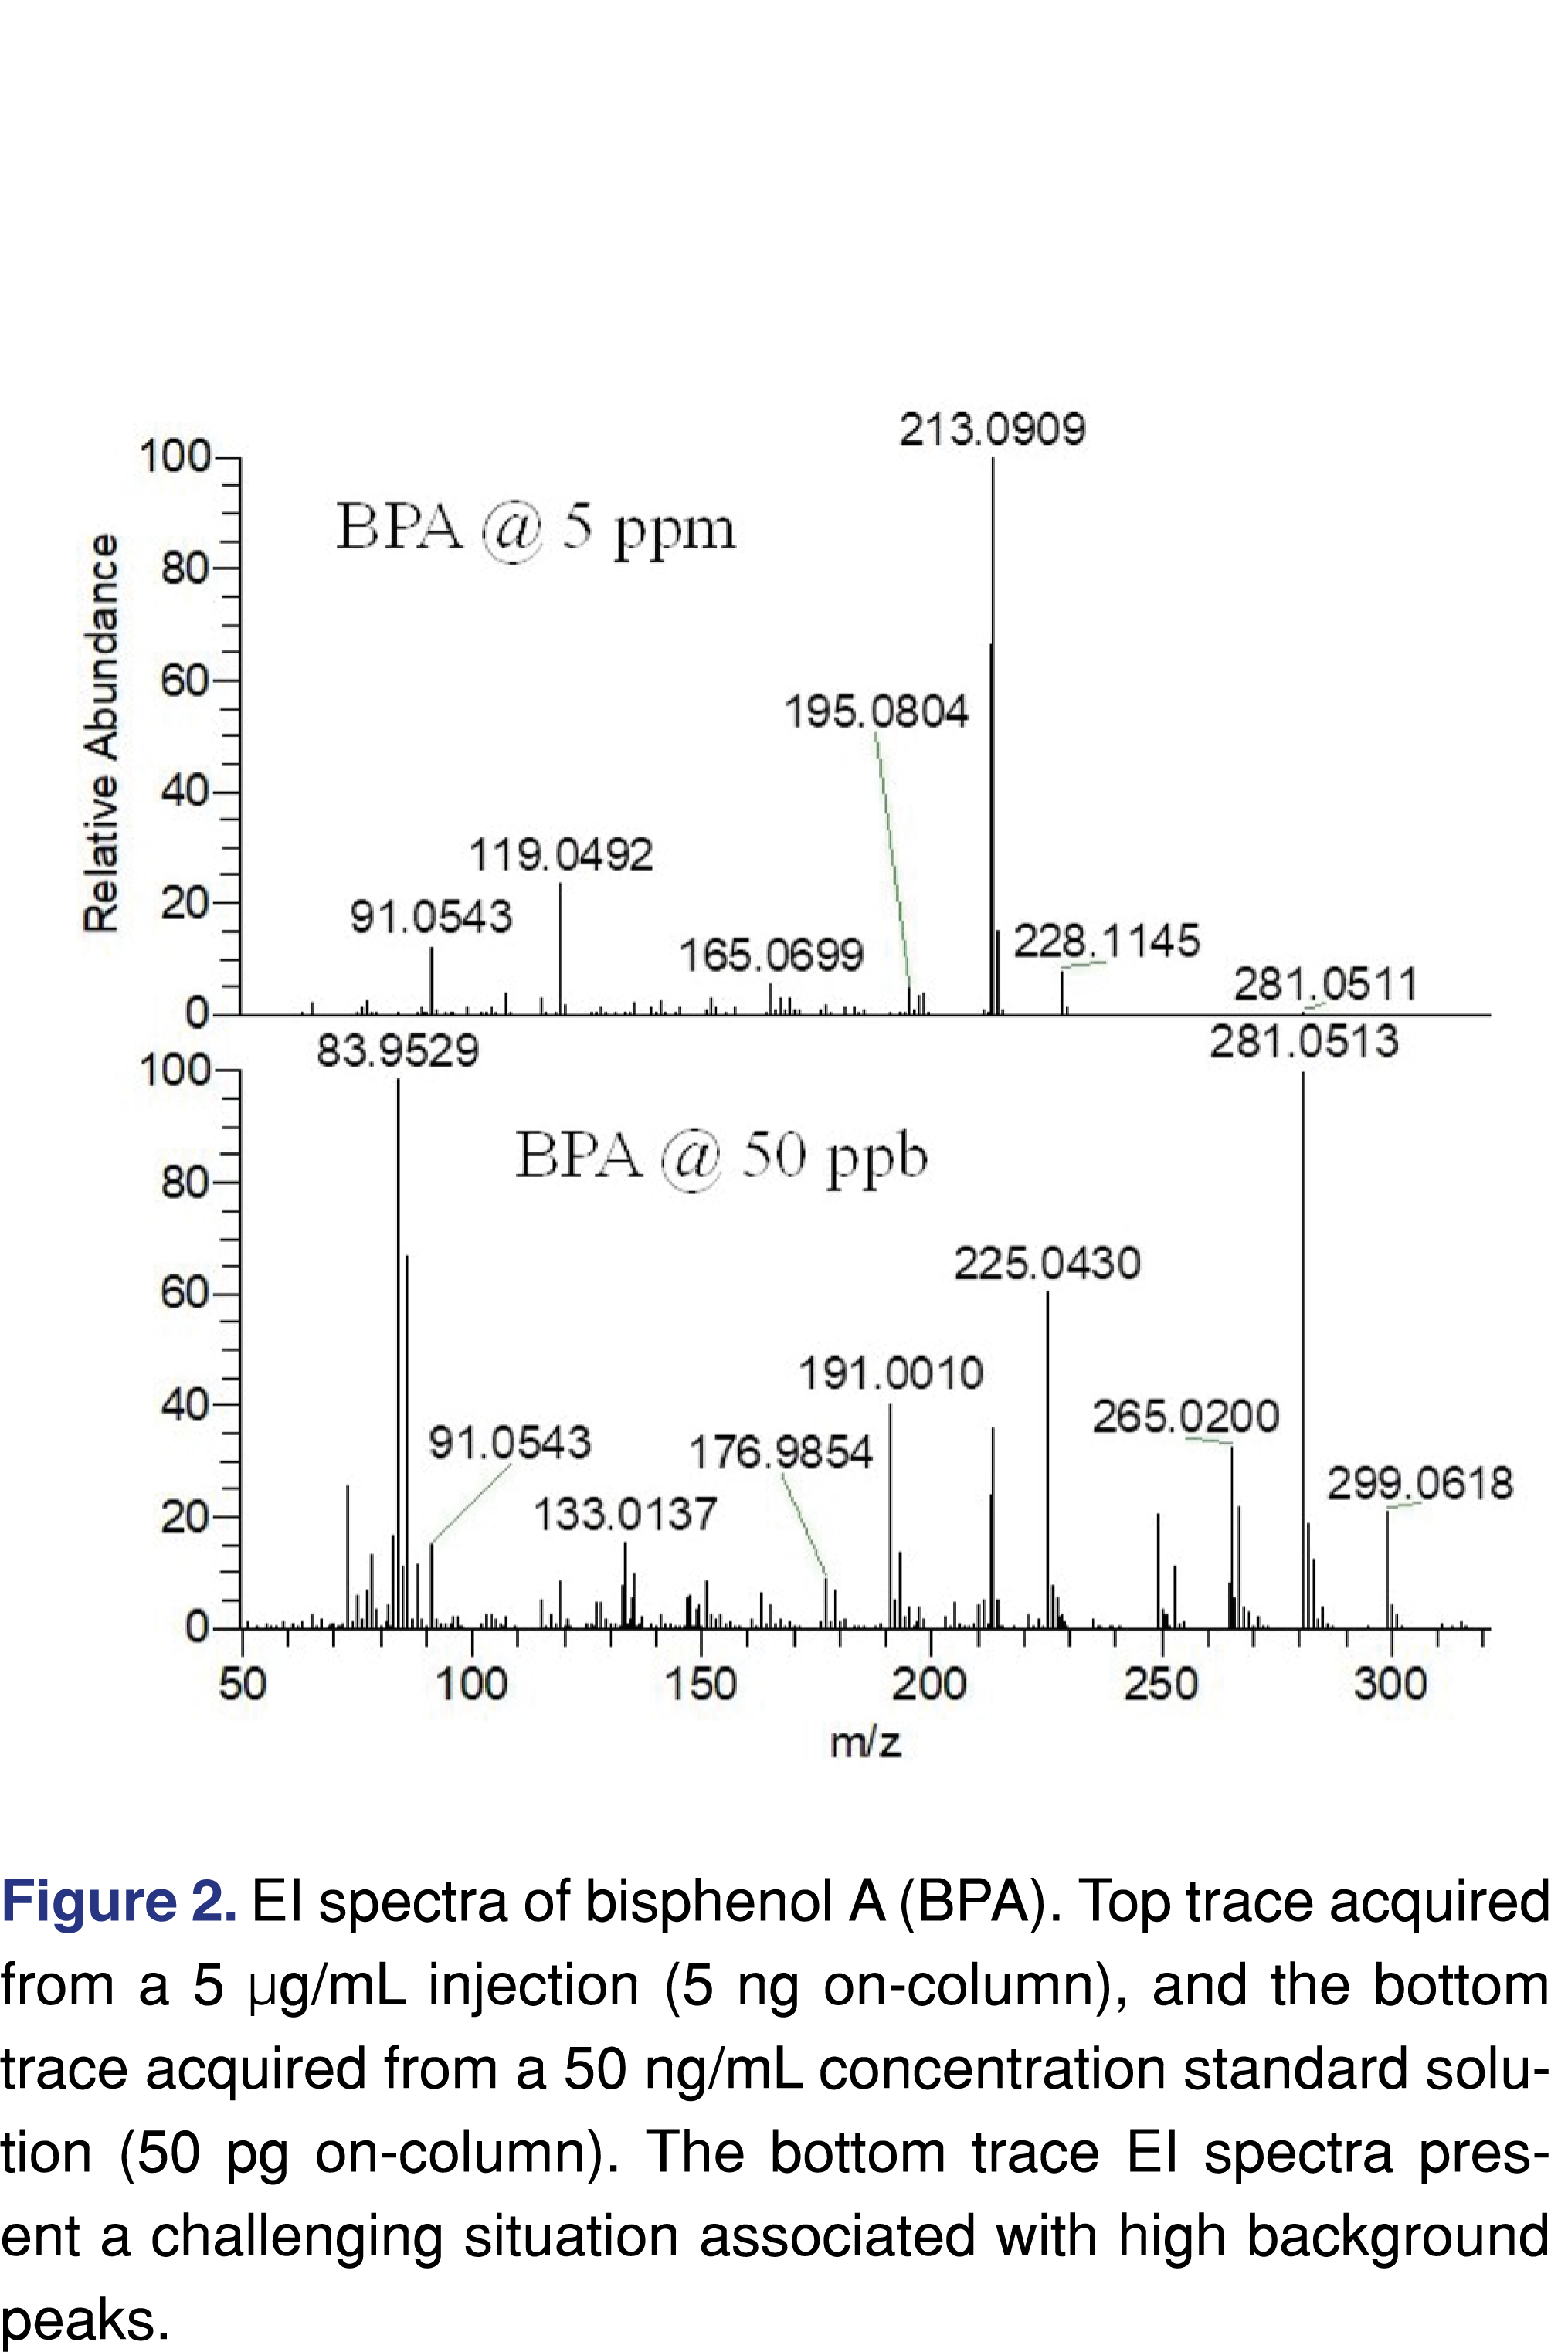
When a non-targeted data collection method is used, spectral interferences are negligible if the evaluation threshold is at a high µg/mL level, while at a low ng/mL level the spectral interferences and background peaks cannot be ignored (see Figure 2). For processing non-targeted data at low levels, it is necessary to use an advanced software platform for peak deconvolution, which will support identification.
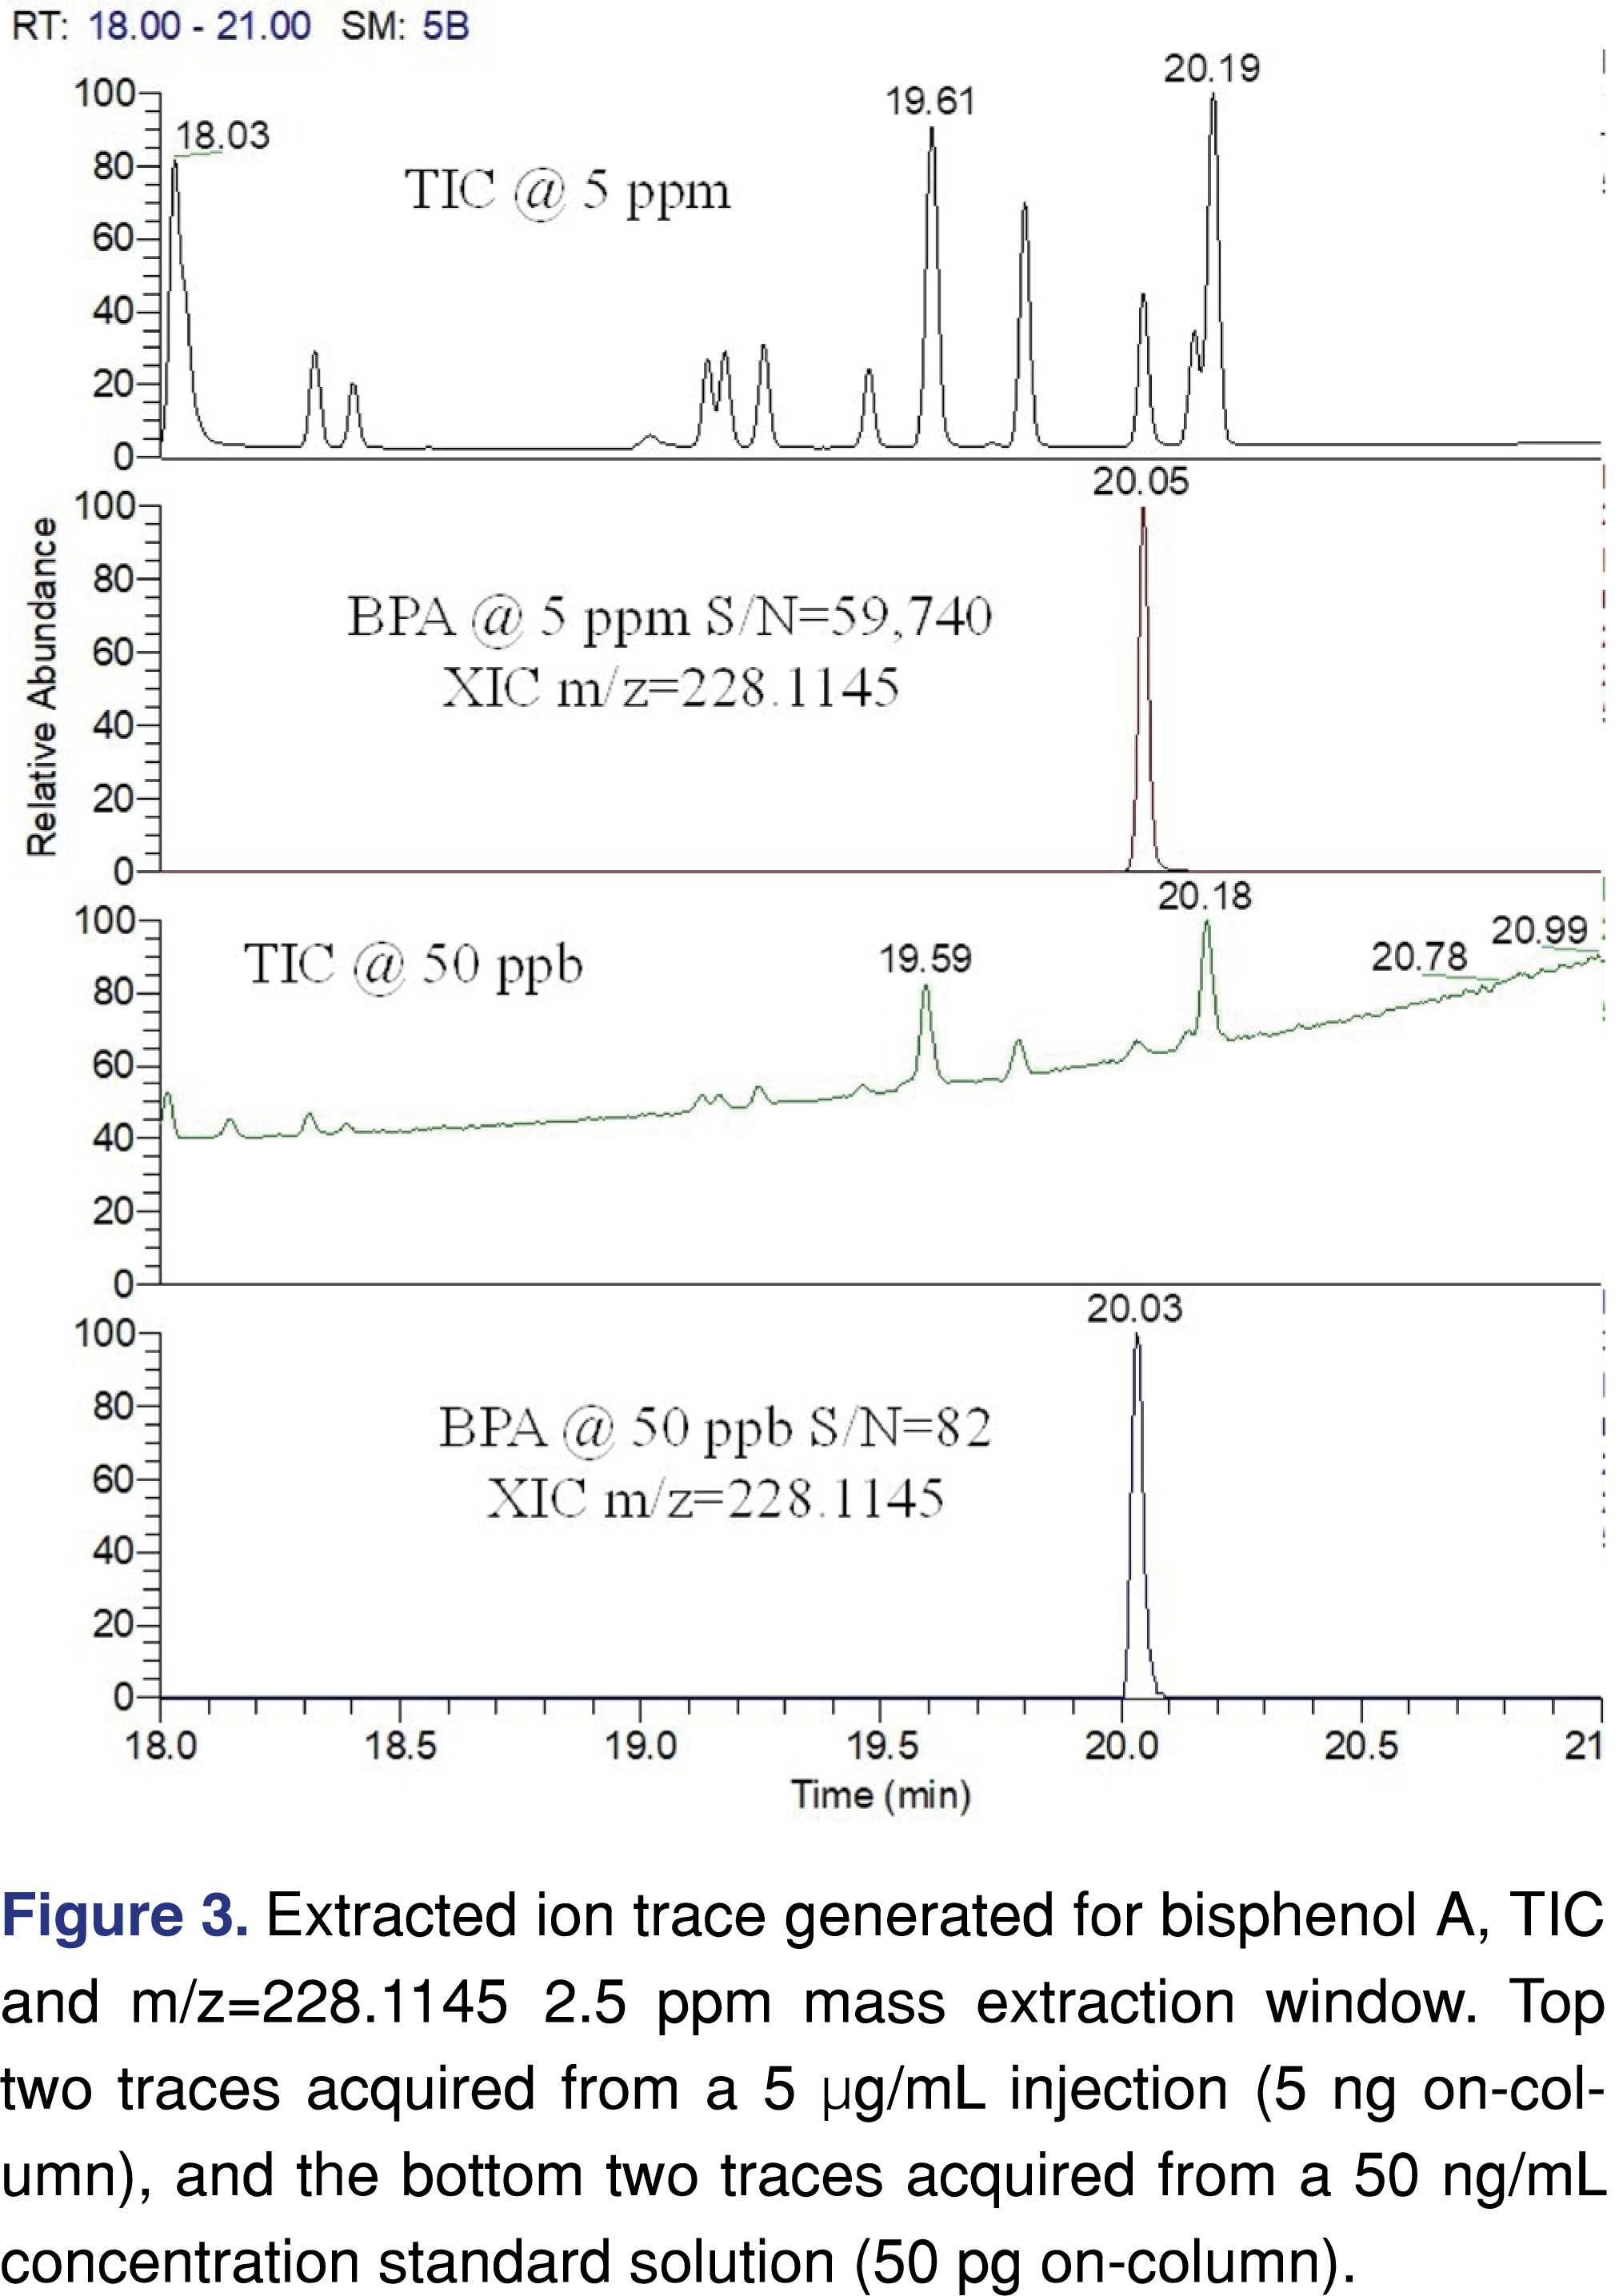
Besides the spectral difficulties present at low levels, chromatography is also more difficult to evaluate when a TIC (Total Ion Chromatogram) is being used. This issue is less significant when a targeted approach is used for the testing as the peaks are detectable at both levels (see Figure 3), and since a narrow 5 ppm wide extraction window was used no chromatographic interference is observed.
Providing information about the software platforms may be particularly beneficial for the reviewer if there are known issues with specific platforms. None of the reports have indicated the software qualification status, however in the recent regulatory environment data integrity is a common problem during FDA audits. If the software is appropriately qualified it provides assurance that acquired data cannot be deleted or modified.
It is important to understand that non-targeted analytical methods have uncertainty related to the fact that chemical species respond differently to detection methods (different UV absorbance, different ionization efficiency, etc.). One of the most appropriate ways to address this issue is to create a multicomponent response factor database, including a range of species with different chemical characteristics. Based on the relative standard deviation of the database responses a factor can be assigned (uncertainty factor aka as UF) [5] and this UF must be used as a correction factor for the AET [section E5 in ref 5]. This reduces the evaluation level for data processing thereby minimizing the number of potential misses of low-responding analytes as is presented in Figure 1. The UF concept is widely accepted to compensate for uncertainties and has been used for a long time in E&L testing [27]. According to the industry best practices and published standards, the UF value used in the study needs to be reported and justified. Many laboratories created a proprietary response factor database which they published [38-40] or presented during scientific meetings. Some of the reports evaluated were issued by laboratories that are known to have a response factor database; therefore, it was surprising that the reports either do not use the UF concept or the laboratory used the outdated approach of UF=2 for both GC-MS and LC-MS. The UF=2 is no longer generally accepted as different values are being recommended: 4 for GC-MS and 10 for LC-MS, [36] or this recent publication proposing to use 3 and 5 respectively for GC-MS and LC-MS [41]. Zero score was awarded to the report when the UF value and justification was not reported, and a score of 1 was used when the UF=2 was used without justification. The highest score was used when appropriate UF was used with justification and documented in the report.
The next part of data processing is to perform identification for all chromatographic peaks reported above the UF-corrected AET level (also defined as final AET level). This task requires the highest level of scientific skills and assigned resources. Based on the author’s personal experience this task is the “Achilles-heel” for most of the reports. Identification is a multistep process involving some combination of commercially available spectral libraries (NIST, Wiley, m/z Cloud), proprietary in-house databases [39-41], manual or software-augmented spectral interpretation, assignment of elemental composition, and different types of MS experiments (1st order scan, multistage MS/MS experiments). Unless the identification process is described in a report, you cannot determine how rigorous the process is [42]. The quality of the identification itself can be measured by a metric called identification categories. The identification categories listed in USP General Chapter <1663> are “tentative”, “confident”, and “confirmed”, and the USP chapter provides a detailed description of each category [11]. The categories are logical, and they are relatively easy to use in daily laboratory practice for an experienced analytical chemist. Unfortunately, USP <1663> does not provide examples for each category, therefore for someone with little experience, it is not straightforward to assign the identification category for the observed analytes. Other organizations and scientific publications use different identification categories and many of them are stricter than the USP categories [43-44]. The quality of identification depends upon the data that was collected, and the instrumentation used. The most straightforward identification is when the peak in question is identical to a known standard in details such as retention time, fragmentation (EI (electron ionization) or CID (collision-induced dissociation)) and isotope patterns match the standard, in which case the identity is confirmed [11]. One level lower confidence in identification can be achieved for example, when the spectra is similar to the record in the commercial library, the elemental composition can be assigned, based on HRAM data, within the required 5 ppm mass accuracy [45], and the isotope pattern matches to the theoretical one, in that case, the identification is confident.
It was a game changer when HRAM-based instrumentation become an affordable analytical tool for laboratories for both GC-MS and LC-MS. LC-MS -HRAM instrumentation is available in most laboratories, and was used to generate reports B, C, and D [42]. GC-MS-HRAM systems were used in reports C and D. This technology is not yet common across the industry [46]. Accurate mass data is required for calculating elemental composition and the selectivity of the narrow mass extraction window provides a high level of confidence for identifying target analytes from non-targeted scan data. The technology led to the development of software applications that process non-targeted MS data (Compound Discoverer, Mass Profiler etc.). Recent discussions between industry scientists led to a conclusion that at least a confident identification is required for reliable toxicological risk assessment. The last two categories are the tentative and the non-identified categories. Tentative is one of the most commonly used categories in the E&L related reports. Tentative means that the laboratory is using a single-stage unit resolution system, therefore the library hit cannot be augmented with elemental composition or MS/MS data acquired from CID experiments. Commonly laboratories simply use the top library hit as the identification without applying acceptance criteria. This situation can be improved with a relatively easy step of adding acceptance criteria using the NIST recommended match factor thresholds as >900 is excellent, >800 good, >700 fair and below 600 is poor [47]. This quality criterion would add some level of confidence, however, even the high spectral similarity would not guarantee proper identification [39]. None of the reports provided acceptance criteria for the library search results. The use of such acceptance criteria for the library search would be helpful for the report review process, as it provides some level of quality assurance of the identification. If the library hit score is below 800, the interpretation of the fragmentation pattern provides an additional layer of confidence to the identification, however, this activity requires expertise. According to USP <1663>, if the laboratory only invested in a single-stage unit resolution instrument, and no authentic reference material is available for confirmation, the highest achievable identification category would be a tentative assignment. The last and maybe the most problematic category is related to unidentified peaks. Those peaks were detected above the UF-corrected AET, spectral data is available however the data is not supporting even a tentative assignment for identification. If the laboratory uses HRAM instrumentation for the testing the category “unknown” can be further refined. Elemental composition can be provided for the peak present in the spectra, some sub-structures can be identified, and for most of the cases, it is a matter of assigned resources if additional information can be provided in the report. For example, in addition to spending more time with the data processing, a more concentrated sample can be generated, or MS/MS data acquisition can be used for the specific peak in question. Reporting “unknown” as a result of the identification process is an unjustifiable, low-quality scientific practice. If the peak is unknown and no spectral information is available, the peak will not be visible [48]. It is better to use the term “unidentified peaks” to indicate some information is available as a peak is present.
It is also important to support the finding of the reports with spectral and chromatographic data, providing evidence of the appropriate analytical work. In many cases during the regulatory review, additional data is requested, if the expert review panel finds insufficient evidence to support the safety and efficacy of the packaging or the medical device. One of the most common issue that the presented chromatograms are not scaled to the AET level, therefore no evidence is available if the analytical methods are fit for the intended purpose of use [49]. This section of the data reporting in the evaluated reports showed less scattered data, however, it seems based on the evaluation laboratory A is an outlier, as the report was barely providing evidence for the performed data analysis and data processing, chromatographic and spectral data was not reported, and all of the observed peaks in LC-MS were reported as unknown.
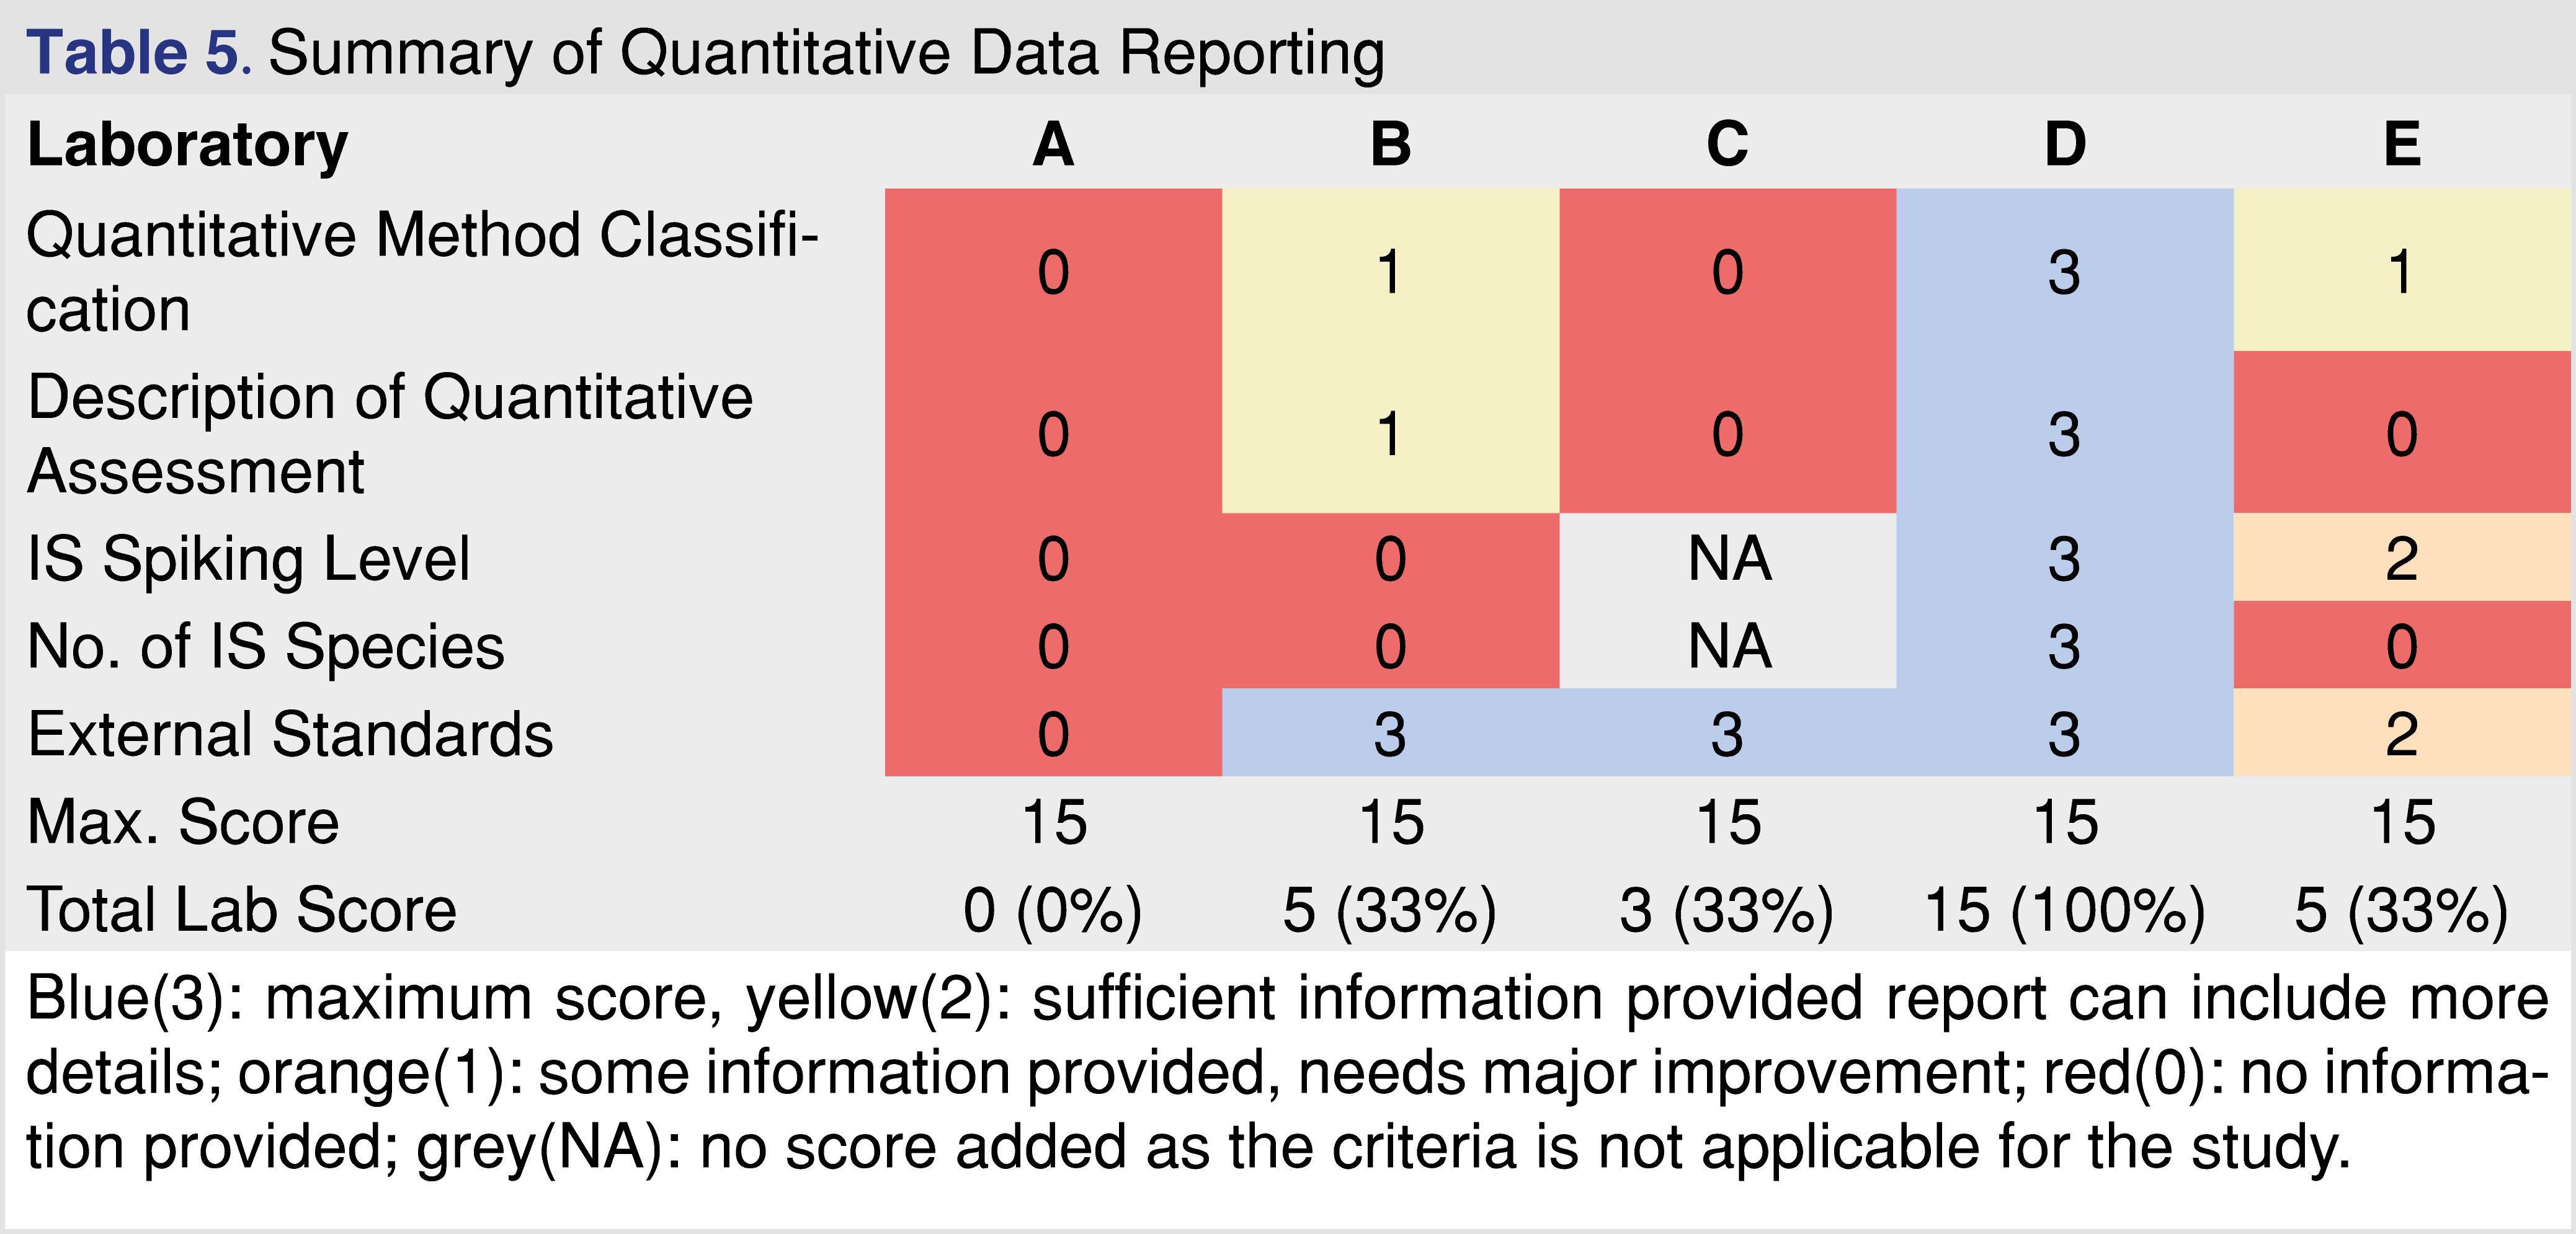
The last category for comparison is the quantitative data reporting, presented in Table 5. It should be clear that regulatory agencies expect data and documentation about how the quantitative assessment was performed. Quantitation is a relatively straightforward activity when reference standards are available and the analytical methods are validated according to industry-accepted standards [29], however, this is not a typical case for E&L and biocompatibility testing. Reference standards are often not available, and many of the analytes identified fall into the confident identification category; the laboratory has a high confidence of the ID, however, it cannot be confirmed, and it can be an isomer (positional isomer or optical isomer), which may provide different responses between the species. There is a need to develop approaches on how to perform appropriate quantitation when no reference standard is available for the target analyte [50]. The selection of an appropriate surrogate standard requires expertise and justification. The quantitative evaluation process must be documented properly, and the author proposes an example calculation that should be provided in the report [49]. The IS spiking level is important especially at low AET levels since it can provide information for the performance of the method(s). If the IS is spiked at the AET level or lower, and if the IS is visible in the chromatograms, the laboratory provides evidence that the method used for the testing has a sufficient LOD at least for the IS species, and therefore if multiple IS are used it can justify the sufficient LOD for wider range of observed impurities. If the spiking level of the IS is much higher than the AET that information cannot be derived easily. The reports associated with different laboratories show a diverse approach to how the quantitative assignment is being performed. Report “A” has significant gaps associated with the quantitative results. It does not show any documentation on how the quantitation was performed, and quantitative estimates of the observed impurities were presented in a tabular format without any justifications, and calculation examples.
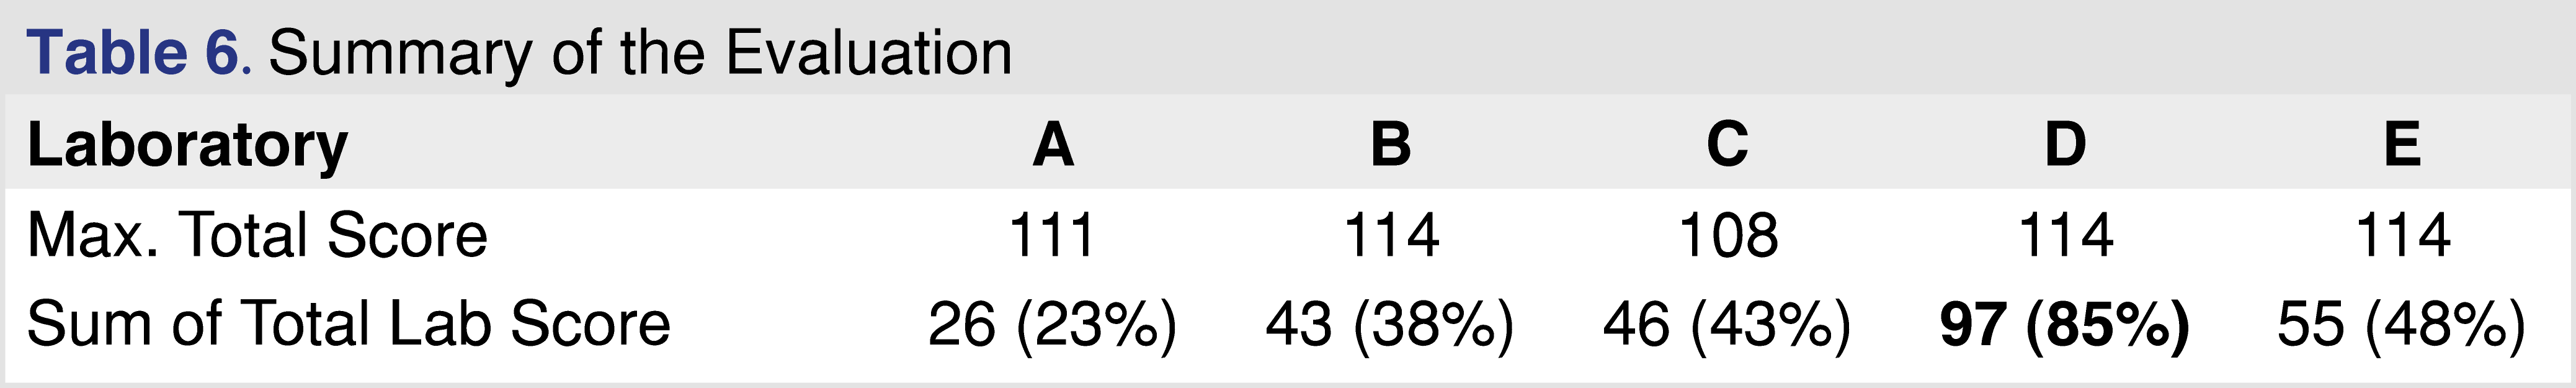
Table 6 shows the overall summary score for the different reports. Based on the data sets presented in those reports it is not possible to draw a general conclusion, however, even the analysis of this limited data set shows significant quality differences between reports. Based on the overall score reports C, D, and E scored above 40%, which may be reasonable compliance with the requirements published in the relevant guidance and standards. It would be relatively easy to improve the score for report C, as the laboratory uses state-of-the-art instrumentation, and the data is available, but the report requires more information to be documented. Although report B is associated with a transdermal system and the standards and regulations published for medical devices are not directly applicable, the evaluation framework from an analytical perspective should be the same as presented for pharmaceutical products [49]. Report A scored the lowest with an overall score of 23%, and this analytical evaluation would be the most difficult to improve, as, besides the detailed description of the objective and scope, the report provided very little information for the rest of the criteria. In general, providing better documentation and sharing more relevant details would improve the evaluation scores significantly, and from a regulatory point of view, a higher score means a lower probability of a deficiency letter.
Figures and Tables
[Click to enlarge]
3.0. Conclusion
A study reporting tool (SRT) published by BP4NTA [20] was modified to address the requirements of published regulatory guidance and international standards [4,22], and used to evaluate E&L and biocompatibility reports from five different laboratories. Based on the data presented here, the implementation of a similar study reporting tool would be helpful to harmonize the effort to present E&L related data packages for regulatory review. The reports show a diverse picture of how data is being reported and how different laboratories deliver information to their clients and regulators. The conclusion was based on the evaluated reports, it does not rate or score the laboratories in a general manner. The reports were evaluated to identify gaps in the reporting process and format and propose ways for improvement and harmonization. Based on the evaluated reports, including more information (methodology, instrument details) would require minimal effort and make a significant improvement to the report quality. It was surprising that even though the FDA guidance and the ISO standard set clear expectations about what needs to be presented in the analytical reports, these standards are not being followed. From the CRO point of view, this type of reporting diversity could cause potential issues, as a laboratory that invests significant effort to properly evaluate and prepare E&L reports with high compliance would be financially non-competitive, which may impact the market in a negative way. To implement a harmonized study/data reporting tool requires some significant effort from the regulatory agencies in a form of published guidances [51-52], however, this would be a more effective approach than focusing on test method harmonization. A harmonized report format and reporting requirements still allow for the testing laboratories to use different instrumentation, range of scientifically justified analytical methods, which are required to deal with such a diverse testing landscape. It is important to emphasize the paper has no intention or claim to score individual laboratories, the conclusions made here were based on the particular reports evaluated.
4.0 References
- Title 21-Food and Drugs Chapter I-Food and Drug and Drug Administration Department of Health and Human Services Subchapter C – Drugs General Part 211 Current Good Manufacturing Practice for Finished Pharmaceuticals, Subpart I. Available at https://www.accessdata.fda.gov/scripts/cdrh/cfdocs/cfcfr/CFRSearch.cfm?CFRPart=211
- Title 21-Food and Drugs Chapter I-Food and Drug and Drug Administration Department of Health and Human Services Subchapter H – Medical Devices General Part 800 Available at: https://www.accessdata.fda.gov/scripts/cdrh/cfdocs/cfcfr/CFRSearch.cfm?CFRPartFrom=800&CFRPartTo=1299
- International Standard ISO 10993-18 First Edition 2005-07-01: Biological evaluation of medical devices – Part 18: Chemical characterization of materials.
- International Standard ISO 10993-18. Biological evaluation of medical devices – Part 18: Chemical characterization of medical device materials within a risk management process, 2nd edition (2020).
- International Standards ISO 10993-18. Biological evaluation of medical devices – Part 18: Chemical characterization of medical device materials within a risk management process AMENDMENT 1: Determination of the uncertainty factor (2022).
- US EPA Methods for Organic Chemical Analysis of Municipal and Industrial Wastewater Method 610 – Polynuclear Aromatic Hydrocarbons (1994). Available at https://www.epa.gov/sites/default/files/2015-10/documents/method_610_1984.pdf
- https://www.epa.gov/chemical-research/status-epa-research-and-development-pfas#methods
- Huang JT, Alquier L, Kaisa JP, Reed G, Gilmor T, Vas G. Method development and validation for the determination of 2,4,6-tribromoanisole, 2,4,6-tribromophenol, 2,4,6-trichloroanisole, and 2,4,6-trichlorophenol in various drug products using stir bar sorptive extraction and gas chromatography–tandem mass spectrometry detection. J Chrom A 1262, 196– 204 (2012). https://doi.org/10.1016/j.chroma.2012.09.010
- United States Pharmacopeia General Chapter <467> Residual Solvents, USP 43-NF 38.
- United States Pharmacopeia General Chapter <1126> Verification of Compendial Procedures, USP 43-NF 38 Currently Official as of 01-Dec-2019.
- United States Pharmacopeia General Chapter <1663> Assessment of Extractables Associated with Pharmaceutical Packaging/Delivery Systems, USP 43-NF 38 Currently Official on 28-Sep-2021.
- Teasdale A et al. Controlled Extraction Studies Applied to Polyvinyl Chloride and Polyethylene Materials: Conclusions from the ELSIE Controlled Extraction Pilot Study. AAPS Pharm Sci Tech 16(3), 664-674 (2014). https://doi.org/10.1208/s12249-014-0249-x
- García ND et al. Large-Scale Assessment of Extractables and Leachables in Single-Use Bags for Biomanufacturing. Anal Chem 90, 9006-9015 (2018). https://doi.org/10.1021/acs.analchem.8b01208
- Stults CL, Ansell J, Shaw AJ, Nagao LM. Evaluation of extractables in processed and unprocessed polymer materials used for pharmaceutical applications. AAPS Pharm Sci Tech 16(1), 150-164 (2015). https://doi.org/10.1208/s12249-014-0188-6
- Jenke D et al. Extractables characterization of five materials of construction of packaging systems used for parenteral and ophthalmic drug products. PDA J Pharm Sci Tech 67(5), 448-511 (2013). https://doi.org/10.5731/pdajpst.2013.00933
- Heise T, Sawyer AY, Hirai T, Schaible S, Sy H, Wickramasekara S. Report on investigation of ISO 10993–12 extraction conditions. Regul Toxicol Pharmacol 131 105164 (2022). https://doi.org/10.1016/j.yrtph.2022.105164
- Ding W, Madsen G, Mahajan E, O’Connor S, Wong K. Standardized Extractable Testing Protocol for Single-Use Systems in Biomanufacturing. Pharm Eng 34(6), 1–11 (2014).
- https://www.biophorum.com/wp-content/uploads/Guide-to-the-extractables-test-report-April-2020.pdf
- https://www.nature.com/jes/authors-and-referees/gta?proof=t
- Peter KT et al. Nontargeted Analysis Study Reporting Tool: A Framework to Improve Research Transparency and Reproducibility. Anal Chem 93, 13870-13879 (2021). https://doi.org/10.1021/acs.analchem.1c02621
- Place BJ et al. An Introduction to the Benchmarking and Publications for Non- Targeted Analysis Working Group. Anal Chem 93, 16289-16296 (2021). https://doi.org/10.1021/acs.analchem.1c02660
- FDA Biocompatibility Guidance 2020, Final Version Use of International Standard ISO 10993-1, “Biological evaluation of medical devices – Part 1: Evaluation and testing within a risk management process”
- https://www.qualio.com/blog/documented-didnt-happen
- P. Ethicist. If It Wasn’t Documented, It Didn’t Happen or Did It?, J Empir Res Hum. 11(2) 199–200 (2016). https://doi.org/10.1177/1556264616654055
- https://nontargetedanalysis.org/srt/
- ICH Harmonized Guideline, Analytical Procedure Development Q14. Draft version Endorsed on 24 March 2022 Currently under public consultation. Available at: https://database.ich.org/sites/default/files/ICH_Q14_Document_Step2_Guideline_2022_0324.pdf
- PQRI Recommendation to FDA, Safety Thresholds and Best Practices for Extractables and Leachables in Orally Inhaled and Nasal Drug Products 8 September 2006. Available at https://pqri.org/wp-content/uploads/2015/08/pdf/LE_Recommendations_to_FDA_09-29-06.pdf
- United States Pharmacopeia General Chapter <1664> Assessment of Drug Product Leachables Associated with Pharmaceutical Packaging Delivery Systems, USP 43-NF 38 Currently Official on 28-Sep-2021
- ICH Harmonised Tripartite Guideline Validation of Analytical Procedures, Text and Methodology (Q2(R1), Step 4 Incorporated in 2005.
- Wenzl T, Haedrich J, Schaechtele A, Robouch P, Stroka J. Guidance Document on the Estimation of LOD and LOQ for Measurements in the Field of Contaminants in Feed and Food, European Commission JRC Technical Reports 2016.
- Vas G, Fleck L, Michelson A, Duett J, Cali J. Back to the Basics; Importance of the Proper System Suitability and Limit of Detection for E&L Studies. Smithers Rapra Extractables and Leachables USA 2022, Arlington VA, USA 7-9 April 2022.
- United States Food and Drug Administration, Guide to Inspection of Quality Systems. 1999 Available at https://www.fda.gov/files/Guide-to-Inspections-of-Quality-Systems.pdf
- Analytical Procedures and Methods Validation for Drugs and Biologics Guidance for Industry, U.S. Department of Health and Human Services Food and Drug Administration Center for Drug Evaluation and Research (CDER) Center for Biologics Evaluation and Research (CBER) July 2015 Pharmaceutical Quality/CMC. Available at https://www.fda.gov/files/drugs/published/Analytical-Procedures-and-Methods-Validation-for-Drugs-and-Biologics.pdf
- Fisher CM, Peter KT, Newton SR, Schaub JA, Sobus JR. Approaches for assessing performance of high-resolution mass-spectrometry non-targeted analysis methods. Anal Bioanal Chem 414(22), 6455-6471 (2022). https://doi.org/10.1007/s00216-022-04203-3
- Norwood D, Michelson A, Dunn N, Duett J, Fleck L, Vas G. Impact of the GC-MS Injection Solvent and the Analyte Concentration on Relative Responses for Common Extractables. Rev Sep Sci 4(1), e22002 (2022). https://doi.org/10.17145/rss.22.002
- Jenke D, Odufu A. Utilization of Internal Standard Response Factors to Estimate the Concentration of Organic Compounds Leached from Pharmaceutical Packaging Systems and Application of Such Estimated Concentrations to Safety Assessment. J Chrom Sci 50(3), 206-2012 (2012). https://doi.org/10.1093/chromsci/bmr048
- Alegre MR, Romero JE, Broch SC. Is it really necessary to validate an analytical method or not? That is the question. J Chrom A, 1232, 101– 109 (2012). https://doi.org/10.1016/j.chroma.2011.10.050
- Jenke D. Correcting the Analytical Evaluation Threshold (AET) and Reported Extractable’s Concentrations for Analytical Response Factor Uncertainty Associated with Chromatographic Screening for Extractables/Leachables. PDA J Pharm Sci Tech 74(3), 348-358 (2020). https://doi.org/10.5731/pdajpst.2019.010520
- Christiaens P, Beusen JM, Verlinde P, Baeten J, Jenke D. Identifying and Mitigating Errors in Screening for Organic Extractables and Leachables: Part 2—Errors of Inexact Identification and Inaccurate Quantitation PDA J Pharm Sci Tech 74(1), 108-133 (2020). https://doi.org/10.5731/pdajpst.2018.009779
- Jordi MA et al. Reducing relative response factor variation using a multi detector approach for extractables and leachables (E&L) analysis to mitigate the need for uncertainty factors. J Pharm and Biomed (186), 113334 (2020). https://doi.org/10.1016/j.jpba.2020.113334
- Jenke D, Christiaens P, Beusen JM, Verlinde P, Baeten J. A Practical Derivation of the Uncertainty Factor Applied to Adjust the Extractables/Leachables Analytical Evaluation Threshold (AET) for Response Factor Variation. PDA J Pharm Sci Technol 76(3), 179-199 (2021). https://doi.org/10.5731/pdajpst.2021.012692
- Vas G, Fleck L, Comstock K, Cole J. Testing for Pharmaceutical Packaging, Finished Pharmaceutical Products, and Medical Devices: An Analytical Perspective. Curr Trends Mass Spectrom 5-14 (2020).
- Sussman EM et al. Chemical Characterization and Non-targeted Analysis of Medical Device Extracts: A Review of Current Approaches, Gaps, and Emerging Practices. ACS Biomater Sci Eng 8(3), 939–963 (2022). https://doi.org/10.1021/acsbiomaterials.1c01119
- Schymanski EL, Jeon J, Gulde R, Fenner K, Ruff M, Singer H, Hollender J. Identifying Small Molecules via High Resolution Mass Spectrometry: Communicating Confidence. Environ Sci Technol 48, 2097-2098 (2014). https://doi.org/10.1021/es5002105
- FDA CVM-118, Guidance for Industry Mass Spectrometry for Confirmation of the Identity of Animal Drug Residues. U.S. Department of Health and Human Services Food and Drug Administration Center for Veterinary Medicine (2003).
- Proceedings of 70th ASMS Annual Meeting, 2022 Minneapolis, E&L Workshop report, available at: https://www.abstracts.asms.org/pages/dashboard.html#/conference/295/toc/295/details
- Thermo Scientific Application note 10598, available at https://assets.thermofisher.com/TFS-Assets/CMD/Technical-Notes/tn-10598-gc-ms-mass-spectral-matching-tn10598-en.pdf
- United States Secretary of Defense Donald Rumsfeld gave to a question at a U.S. Department of Defense (DoD) news briefing on February 12, 2002. https://en.wikipedia.org/wiki/There_are_known_knowns#:~:text=We%20also%20know%20there%20are,know%20we%20don’t%20know.
- FDA Generics Drug Forum 2021, Patricia Onyimba OLPD|OPQ|CDER. Assessment of Extractables/Leachables Data in ANDA Submissions. US FDA Presentation Available at. https://sbiaevents.com/gdf2021/#files
- Abrahamsson DP, Park J-S, Singh RR, Sirota M, Woodruff TJ. Applications of Machine Learning to In Silico Quantification of Chemicals without Analytical Standards. J Chem Inf Model 60, 2718-2727 (2020). https://doi.org/10.1021/acs.jcim.9b01096
- Center for Drug Evaluation and Research (CDER) Reviewer Guidance’ Validation of Chromatographic Methods (1994).
- U.S. Department of Health and Human Services Food and Drug Administration Center for Drug Evaluation and Research (CDER) Center for Biologics Evaluation and Research (CBER), Guidance for Industry Analytical Procedures and Methods Validation for Drugs and Biologics Draft Guidance (2014).
All site content, except where otherwise noted, is licensed under a Creative Commons Attribution 4.0 License