OPEN-ACCESS PEER-REVIEWED
RESEARCH ARTICLE
Gyorgy Vas1,2*, Louis Fleck2, Anna Michelson2, Nicole Dunn2, John Duett2, and Jacquelyn Cali2
1VasAnalytical, Flemington, NJ 08822, USA; 2Intertek Pharmaceutical Services, Whitehouse, NJ 08888, USA.
Reviews in Separation Sciences. Vol.3. No.1. pages 3-20 (2021).
Published on-line 01 March 2021. https://doi.org/10.17145/rss.21.002 | (ISSN 2589-1677).
*Correspondence:
Vas G et al. . VasAnalytical, Flemington, NJ 08822, USA and Intertek Pharmaceutical Services, Whitehouse, NJ 08888, USA.
Editor: Mark Shapiro, MCS Pharma Consulting LLC, Stokesdale, NC 27357, USA..
Open-access and Copyright:
©2021 Vas G et al. This article is an open access article distributed under the terms of the Creative Commons Attribution License (CC-BY) which permits any use, distribution, and reproduction in any medium, provided the original author(s) and source are credited.
Funding/Manuscript writing assistance:
The authors declare that no funding and writing assistance was utilized in the production of this article.
Competing interest:
The authors have declared that no competing interest exist.
Article history:
Received 02 October 2020, Revised 08 January 2021, Accepted 26 January 2021.
Abstract
Leachable testing for finished pharmaceutical products is an important part of the regulatory filing and is under more regulatory scrutiny than ever before. Leachable testing for multiple finished drug products such as biologics, large volume parenterals, and polymer-based finished products requires analysis at trace levels with a high level of confidence. A high level of analytical expertise and top-of-the-line analytical instrumentation is required for work at trace levels. (The definition of trace level analytical testing has not been accurately defined; however, to have a sense of the “trace-level”-associated testing issues, we are arbitrarily assigning levels below 100 ng/mL as trace level and below 1 ng/mL as ultra-trace level in this paper). Leachable testing ideally should be performed on a targeted list of analytes compiled from an extractable study and an extractable and leachable correlation study, along with a general non-targeted screening evaluation to avoid any undetected leachables. For targeted screening, analytical testing is more straightforward and can typically detect targets at ppb or sub-ppb levels without issue. However, for a general screening method, this can be difficult, and many times requires special sample preparation combined with high-resolution accurate-mass detection.
Case studies will be presented to demonstrate the importance of high-performance and highly sensitive screening methods in detecting unexpected leachables, and in supporting related quality investigations. The importance of well-designed and executed system suitability will also be discussed in this paper.
Keywords
E&L testing, relative response factors, GC-MS, sample preparation, large volume parenterals, medical device.
1.0 Introduction
Leachable testing of finished pharmaceutical products is an essential part of their safety assessment [1-4], and sufficient information should be included in regulatory filings for every NDA, ANDA and BLA. Required evaluation for leachables includes rigorous analytical testing for chemical species present in the drug product originating from the primary and secondary pharmaceutical packaging or even migrating from tertiary or quaternary packaging components such wood pallets (2,4,6-tribromoanisole; in that particular case) [5,6]. Those leachables or migrants may pose a risk to the patient, and, as contaminants/impurities, the expectation is to control them at a lower level than the API related impurities [7].
Detection of these low-level impurities can be challenging for analytical laboratories. The level of evaluation (analytical evaluation threshold or AET) for leachables is determined by the associated risk category of the finished product, the duration of the treatment and the daily dosage of the finished product. The risk category determines if a safety concern threshold (SCT) of 0.15 µg/day (inhalation-based products) or 1.5 µg/day (for other delivery routes) will be applied [8]. The daily dose of the finished product and number of the doses in a particular packaging presentation are also very important factors in determining the evaluation level of the analytical testing. Whereas a single small dose (1 tablet or less than 1 mL/day solution) will have a relatively high AET, in contrast a large volume parenteral dosage of multiple liters/day can result in sub-ppb AET levels. It is clear and obvious that different analytical approaches are required to handle leachables at a ppm level vs. low ppb or sub ppb levels, yet the expectation for a reliable and robust screening method demonstrating similar performance for both extremely low levels and conventional analytical levels exists.
For identified and qualified leachables, a targeted method can be used. However, this method may not be suitable for addressing newly formed or unexpected leachables. The expectation for today’s leachable testing approach is to have a targeted method, which can be validated according to industry expectation [9,10], as well as a high performing, robust, and sensitive screening method, which is usually based on mass spectrometry. The major benefit for a high performing screening method is that a wide variety of leachables can be evaluated and some level of quantitative estimation can be performed in one step, without a formal analytical method validation or authentic standards [11,12]. Though quantitation during screening is an essential task for the proper evaluation of extractables and leachables species, quantitation in E&L screening is not without its challenges [8,13,14]. Quantitative evaluation processes used in screening vary widely, and it is, therefore, no surprise that results vary widely across techniques, and are less accurate than validated methods with specified target compounds. When screening methods are used for quantitative assessment, it is important to understand the limitations and the applicability of the approach.
The drawback of a general screening method for quantitative estimation is that different organic species have different response factors even under a thermodynamically controlled ionization process such as EI in GC-MS. Different organic compounds have different ionization yields, and their fragmentation likewise results in ions of different intensities. Therefore, different compounds will exhibit different instrumental response even when the same amount is analyzed (in some aspects the MS total ion chromatogram can be representative and useful for quantitation as a GC-FID trace). Another factor that is less discussed across the industry but has equal importance to components’ response is the sample introduction process. The individual component polarity and volatility both significantly impact the final signal response in the GC-MS analysis. However, there are ways to handle the uncertainty associated with the difference in responses of different compounds. The most widely used approach is to use the PQRI response uncertainty factor (UF) of 2 [15] when a reference standard material is not available to use individual response factor/relative response factor (IRF or RRF). However, this valuable document in some cases may be misinterpreted, since the value should not to be construed as UF=2 by default [14]. The uncertainty factor should be determined based on the %RSD of the individual responses of reference materials present in a response factor database [16]. More recently published data indicate that a UF of 3 or even 4, maybe more appropriate, and it is a better practice to use individual response factors [17]. However, even if a database with a large number of entries is used, the analytical chemist should understand the limitations, and should carefully review and evaluate the data. Example cases will be presented to show some of the limitations of such databases [18]. It is important to note that the general UF concept is not appropriate for LC-MS based data sets [17,19] or data sets generated by either low energy EI or chemical ionization GC-MS.
Extractable studies are complex investigational studies. Since they usually target test objects and test materials that previously have not been studied by the laboratories on a routine basis, the nature and the level of the associated impurities are not exactly known. The primary objective of the studies is material characterization, and the approach is mainly qualitative (identifying impurities with the highest confidence level). Thus the major analytical tools to complete that task are chromatographic techniques hyphenated with mass spectrometric detection. However, there is a requirement to have an estimate for the level of those identified components. A series of carefully selected standards can be applied during the analytical process which should be representative (chemically) of the expected target impurities [13,16,20].
It needs to be clear that the extractable part of the E&L testing workflow process is executed in a non-GMP fashion from the point of view that targets are not known at the beginning of the study and that methods cannot target specifically identified analytes. On the other hand, instrumentation needs to be appropriately qualified and calibrated, proper system suitability parameters have to be implemented, and the documentation must be performed to comply with cGMP expectations, so as to be able to provide meaningful and indisputable data. Since universal screening methods are not validated, conditions should be standardized to the extent possible but still allow adjustments to accommodate different instrument platforms and to evaluate different materials. By contrast, the leachables testing of the finished DP must comply with higher regulatory rigor, and therefore some level of method verification/validation needs to be performed, with at minimum robust system suitability as part of the sample testing.
Recent queries and deficiency letters from the regulatory agencies indicate that some of the analytical approaches for leachable testing may not be acceptable, and the analytical process needs to be “fine-tuned”. This includes queries regarding targeted and untargeted leachable detection techniques, application of uncertainty factors, and choice of surrogate standards, demonstration of system suitability, and demonstration that methods are fit for the use of intended purpose.
The term “high performing screening method” used in this paper is defined as one which meets the following set of performance criteria:
– Generally applicable for a wide range of sample matrices and a wide range of target analytes
– Capable of extracting and concentrating target analytes for detection at ng/mL to sub ng/mL level
– Easy automation of the whole process, including sample preparation
– Compliance with industry data integrity expectations
The paper is divided into multiple sub-parts, each sub-part focusing on a particular testing related issue:
– Leachable screening method supporting manufacturing-related investigations
– Analytical approaches to evaluate relative response factors.
– Drug delivery device leachable evaluations
– Issues associated with large volume parenteral
– Aspects of method and system suitability
2.0 Experimental
2.1. Chemicals and Standards
Chemicals including LC-MS grade water and UltraTrace purity dichloro-methane and standards were purchased from Sigma Aldrich (St. Louis MO, USA).
2.2. Sample Methods
2.2.1. Liquid-Liquid Extraction of Aqueous Samples
Five mL of the aqueous sample was extracted 3 times with 5 mL of dichloromethane. The organic phases were pooled and dried with anhydrous sodium sulfate. After the drying process was completed the organic phase was removed and concentrated under a nitrogen stream until a 10 x concentration factor was achieved. Concentration to dryness needs to be avoided to reduce the significant loss of volatiles [21]. In some case studies the aqueous samples were spiked with appropriate level of recovery internal standard (IS/RS). For others, the final concentrated extracts were spiked with appropriate level of internal standard (IS). A surrogate or volumetric Internal Standard (IS) [8,22] is added at known quantity to the final extract to monitor and correct the uncontrolled variations of sample volumes being injected into the analytical system [23].
Recovery internal standards (IS/RS) are added at known quantity to the samples before the extraction process takes place. A carefully selected and evaluated recovery internal standard theoretically addresses all the variables related to extraction, sample concentration and the injection process. In many cases, an appropriately selected and well justified IS/RS provides a more accurate quantitative estimate, especially for a process with known low recovery. The exact spiking level of the added standards is listed in specific case studies.
2.2.2. SPME Extraction of Aqueous Samples and Finished DP Samples
One or two mL of each aqueous sample was placed in a 20 mL HS vial and spiked with an appropriate level of IS/RS, and the vials were sealed with high purity PTFE-coated silicone septa (Gerstel). Samples were incubated at 85 °C for 10 minutes and extracted with a 100 µm polydimethylsiloxane extraction fiber. The extracted analytes were thermally desorbed from the PDMS fiber in a hot PTV injector at 250 or 260 °C using splitless injection mode. (Note that SPME injection is not influenced by solvent evaporation vs. injecting liquid to the system [24,25]). For SPME-Arrow sampling a 1.1 mm PDMS extraction fiber with 3.8 µL phase volume was used.
2.3. GC-MS Methods
Thermo Scientific TSQ Quantum Ultra XLS® triple quadrupole GC-MS system (referenced as TSQ) was used in the majority of the case studies, except for the unexpected peak investigation where a Thermo Scientific GC-Orbitrap® High Resolution Accurate Mass System (referenced as GC-Orbi) was used for the testing [26]. Both systems were equipped with a PTV injection system [27,28], which were used either in hot constant temperature splitless mode at 250 °C with a 0.5 minute splitless time, or in a temperature-programmed injection mode where the injection was made at 50 °C with 0.1 minute hold time and heated to 275 °C at a rate of 12 °C/sec with a splitless valve closing of 0.75 minute. For TSQ, a Restek Rxi 5 MS 40 m x 0.18 mm dimension, 0.180 µm film thickness (β=250) column with hydrogen gas carrier was used at 40 cm/sec linear velocity with constant flow at 1.1 mL/min. For the GC-Orbi system, a Restek Rxi 5 MS 30 m x 0.25 mm with 0.25 µm film thickness (β=250) with He carrier at 1.2 mL/min constant flow was used. The temperature program was identical for both systems starting at 50 °C (1-minute hold) to 300 °C at 25 °C/min (3-minute hold). Both systems were used electron ionization at 70 eV energy with 50 µA current. The TSQ system was equipped with a DuraBrite™ ion source at 275 °C and the GC-Orbi was equipped with an ExtractaBrite™ ion source operated at 275 °C.
2.4 Case Studies
2.4.1 Leachable Stability Screening Method for Investigation of Unknown Peaks
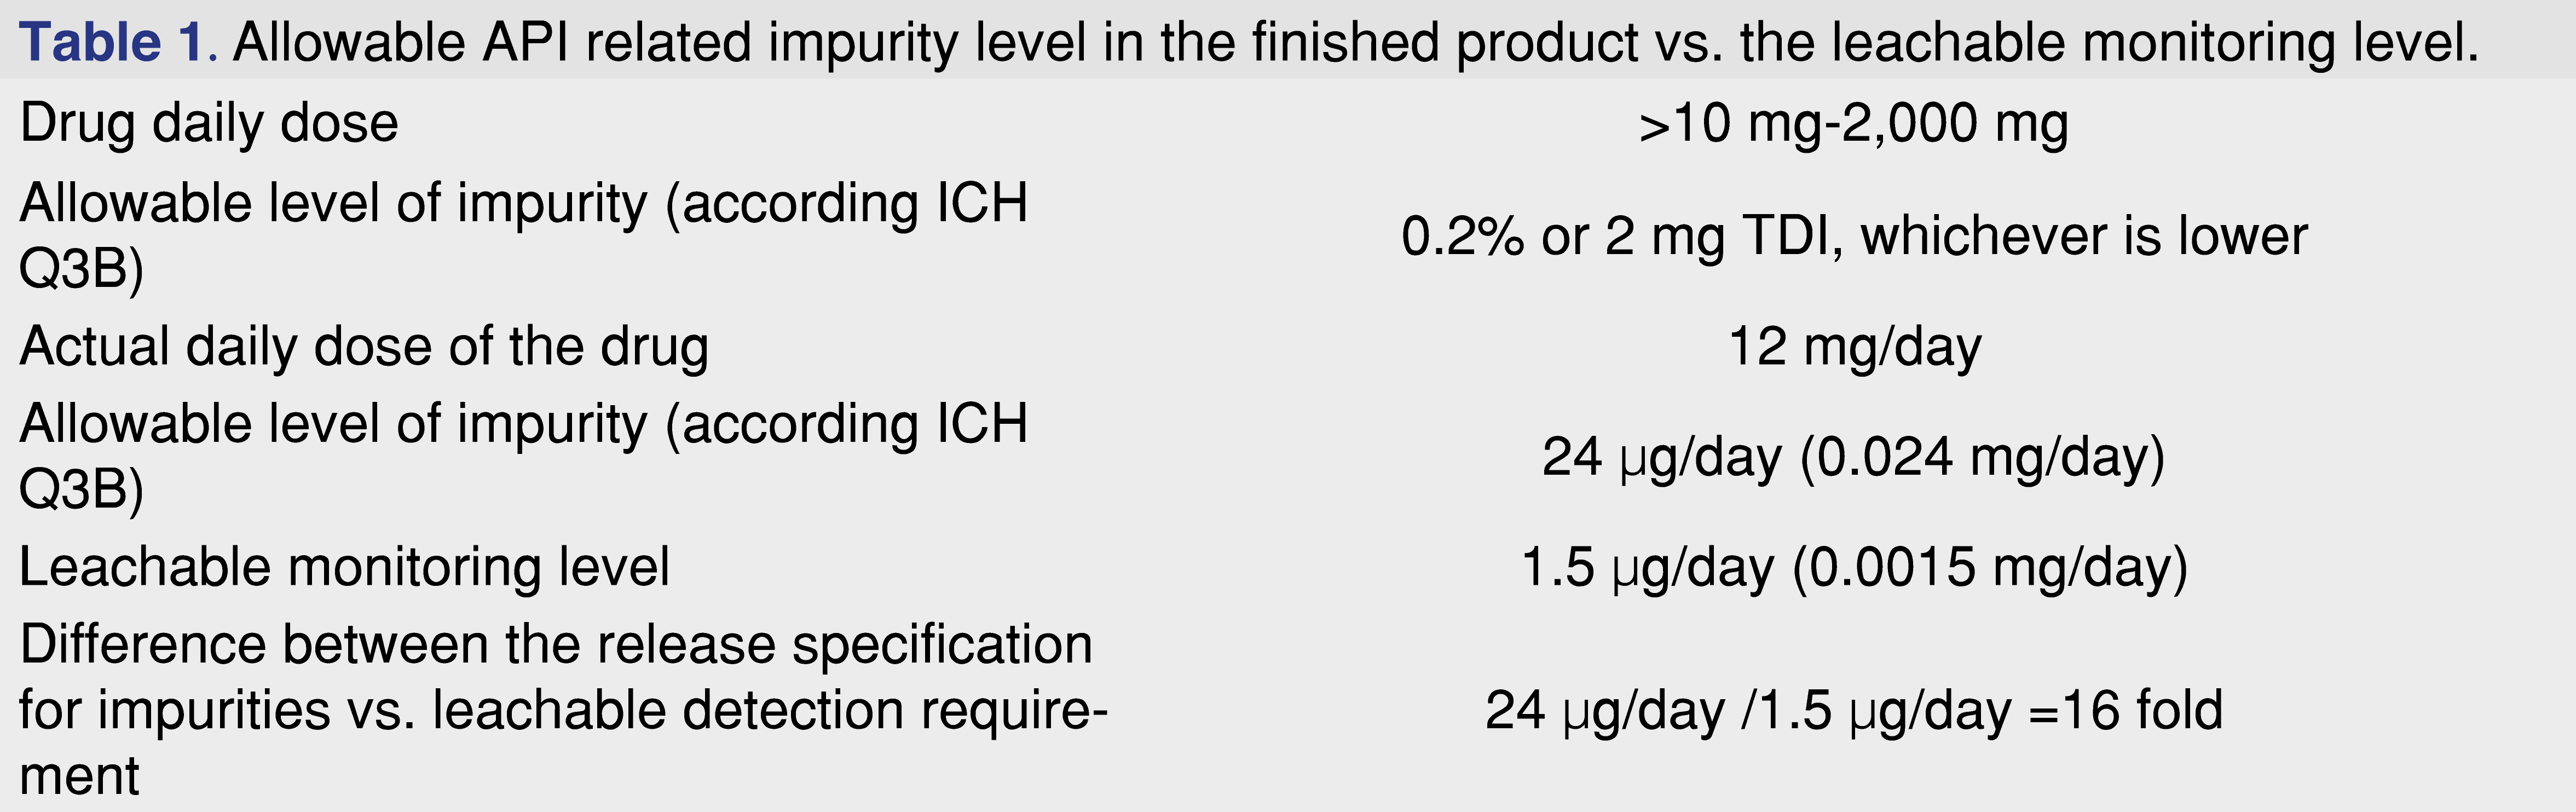
Several years ago, a case of trace-level migrant chemical from wood pallets caused a multi-billion dollar impact on the pharmaceutical and the food industry. Companies such as General Mills from the food sector as well as Pfizer and J&J from the pharmaceutical industry recalled multiple products due to contamination with a degradation product of a brominated fire retardant used to treat wood pallets [5,6]. Since this migrant, 2,4,6-TBA, has an extremely low sensory threshold, it can be easily detected by the human nose, and therefore it was relatively easy to identify its presence. However, it was extremely difficult to detect and quantify this impurity under cGMP conditions, using a validated analytical methodology that could approach the threshold sensitivity of the human olfactory system [29]. Without having sensory support (either visual or by other senses), some other unexpected impurities may be present which are not easy to detect and identify. The pharmaceutical industry has changed significantly in the past decade, as many pharmaceutical companies stopped on-site manufacturing and outsourced manufacturing to contract manufacturing organizations. As a result of this paradigm shift, the product owner has less control of the manufacturing process. Multiple drug products may be manufactured for different companies using the same manufacturing line in a different time-frame. Therefore, it is very important to have a robust and appropriate method to assess the effectiveness of the cleaning process of the manufacturing parts and to avoid possible cross-contamination from previous manufacturing campaigns. CMOs usually develop and validate cleaning methods at levels related to the API and the qualified impurities for practical and economical reasons, and this approach works in most cases. However, it is important to understand that in some situations there is a significant gap between the maximum dose API-based allowable impurity levels versus the daily dose calculated AET which should be used to monitor leachables in the stability studies. An example of the existing gap is presented in Table 1.
Based on the data presented in Table 1, there is a significant 16-fold gap between the API-related impurity level and the level that should be monitored for a leachable screening method (associated numbers are presented in Table 1). Therefore, if the cleaning validation method was developed based on the allowable API impurity level, the method’s LOD or LOQ most probably would not address the method requirement of detecting species at a level 16 times lower.
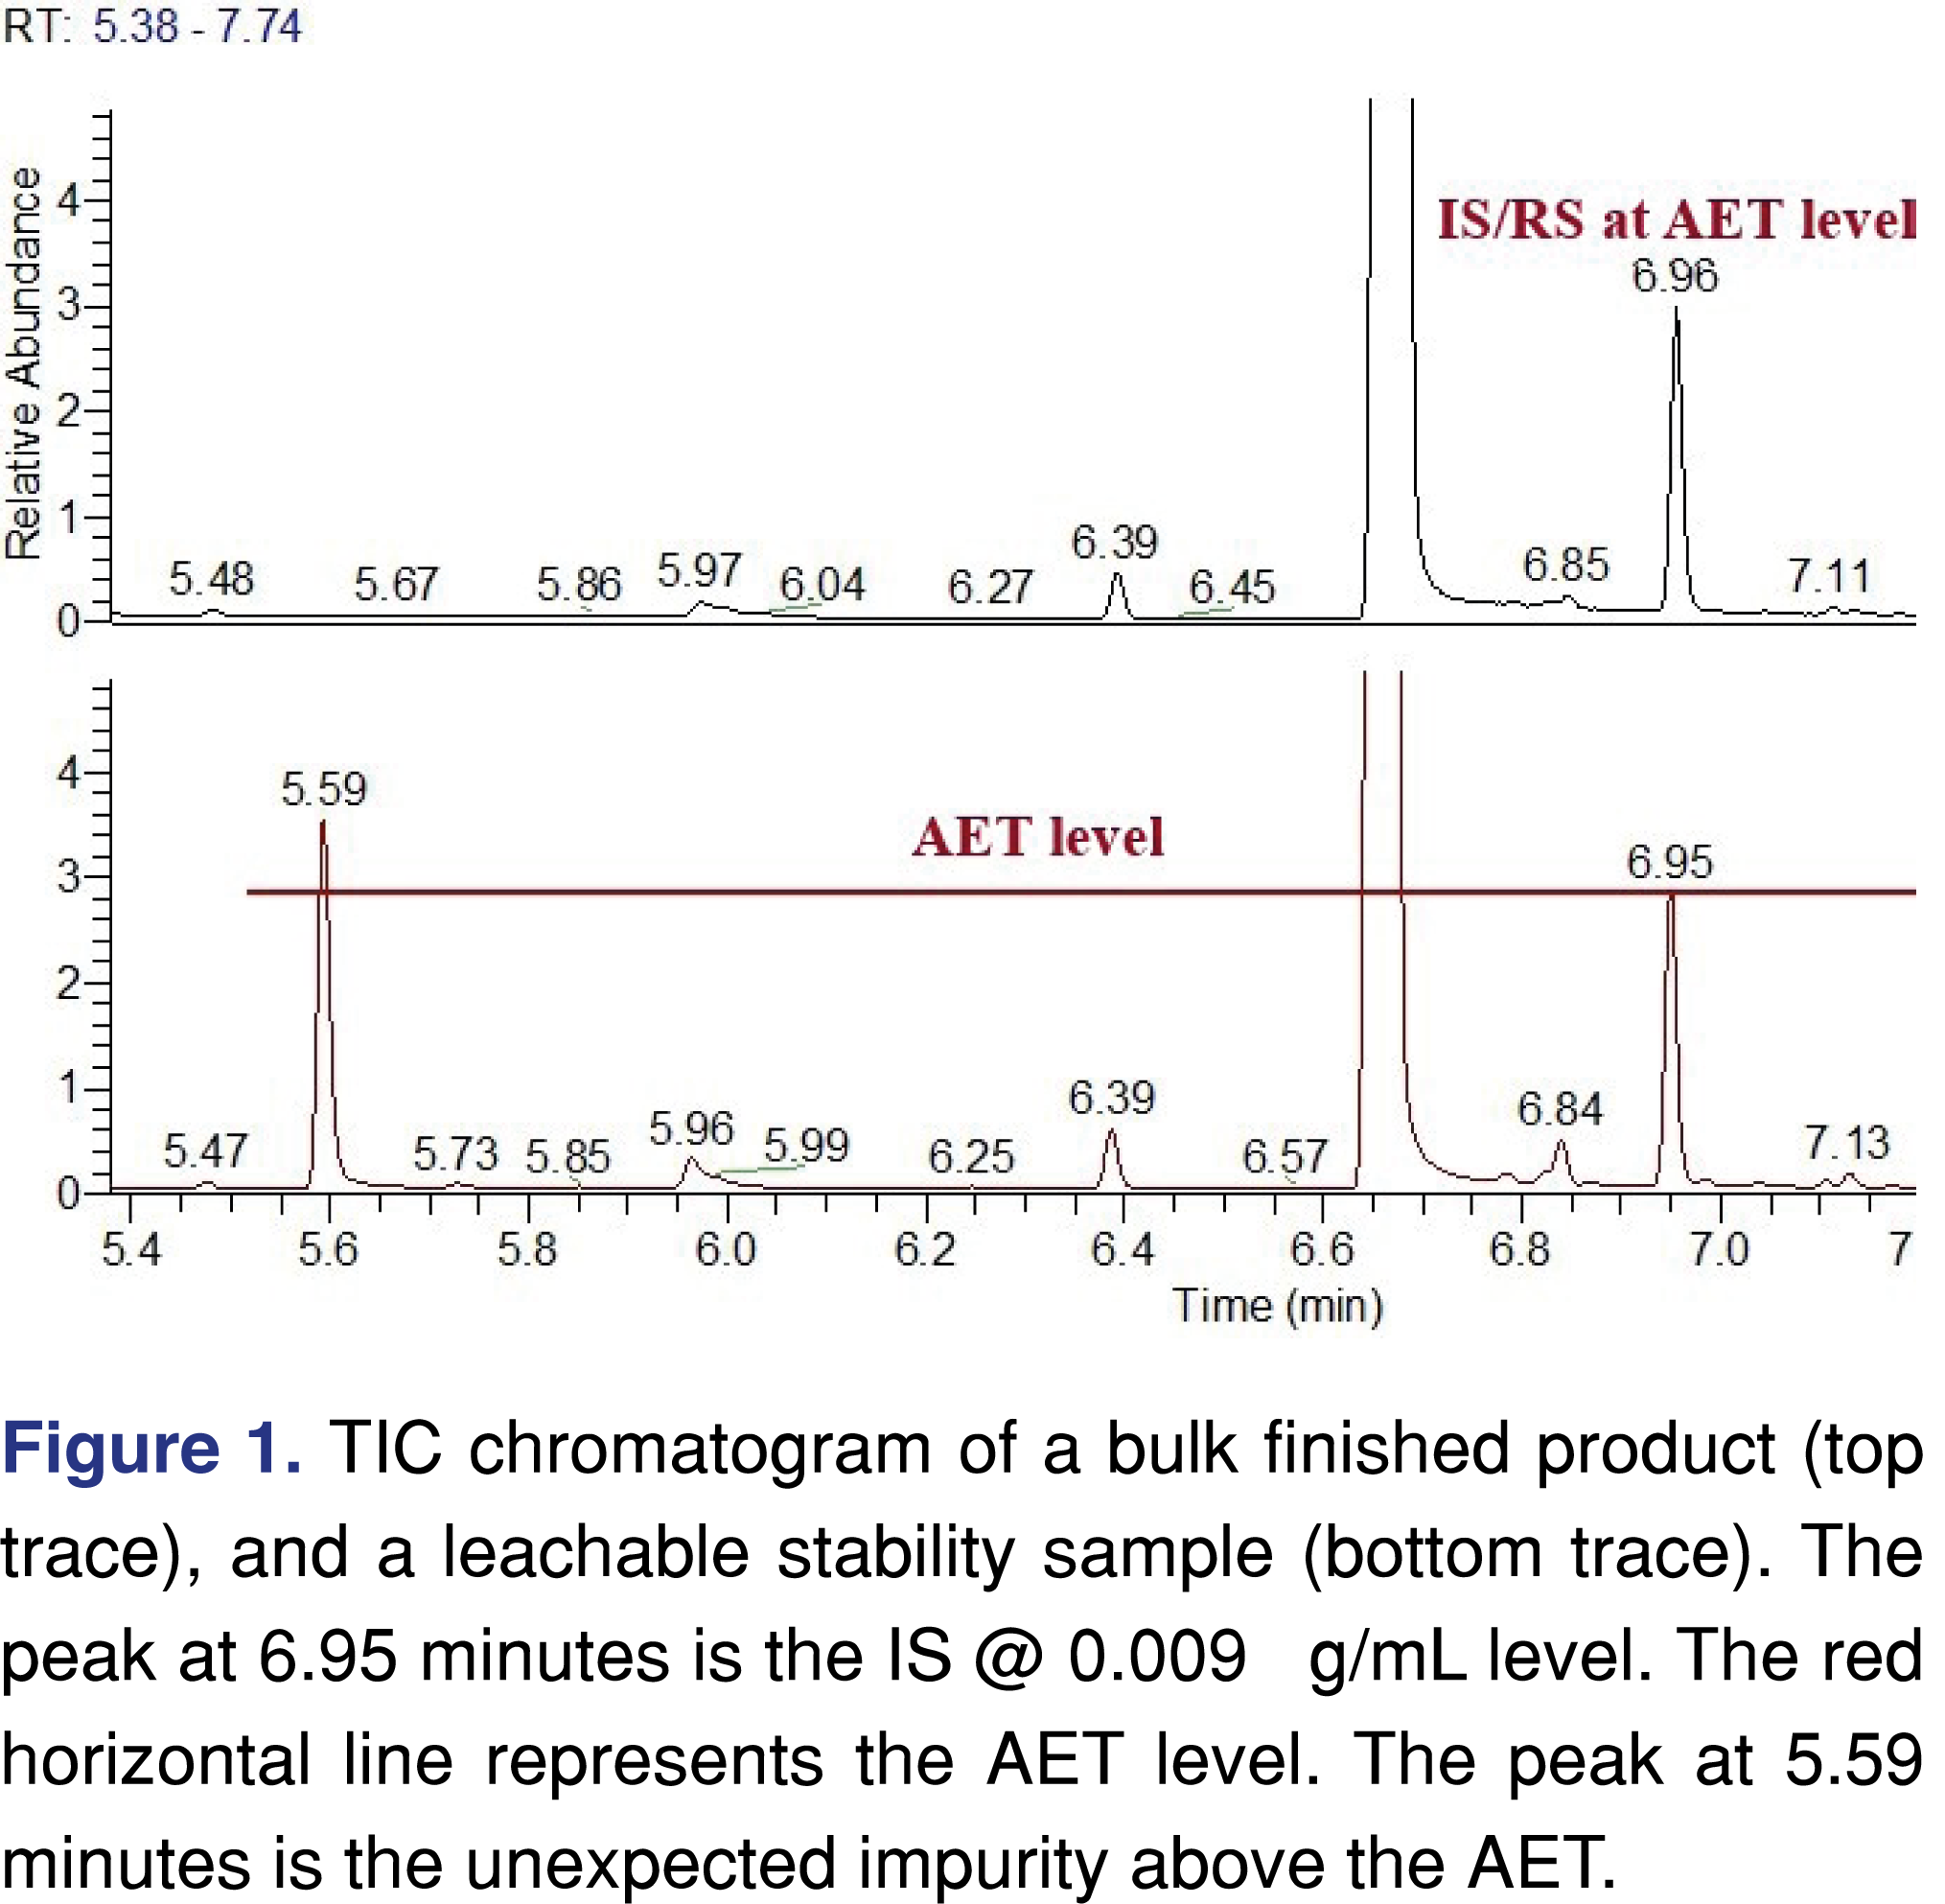
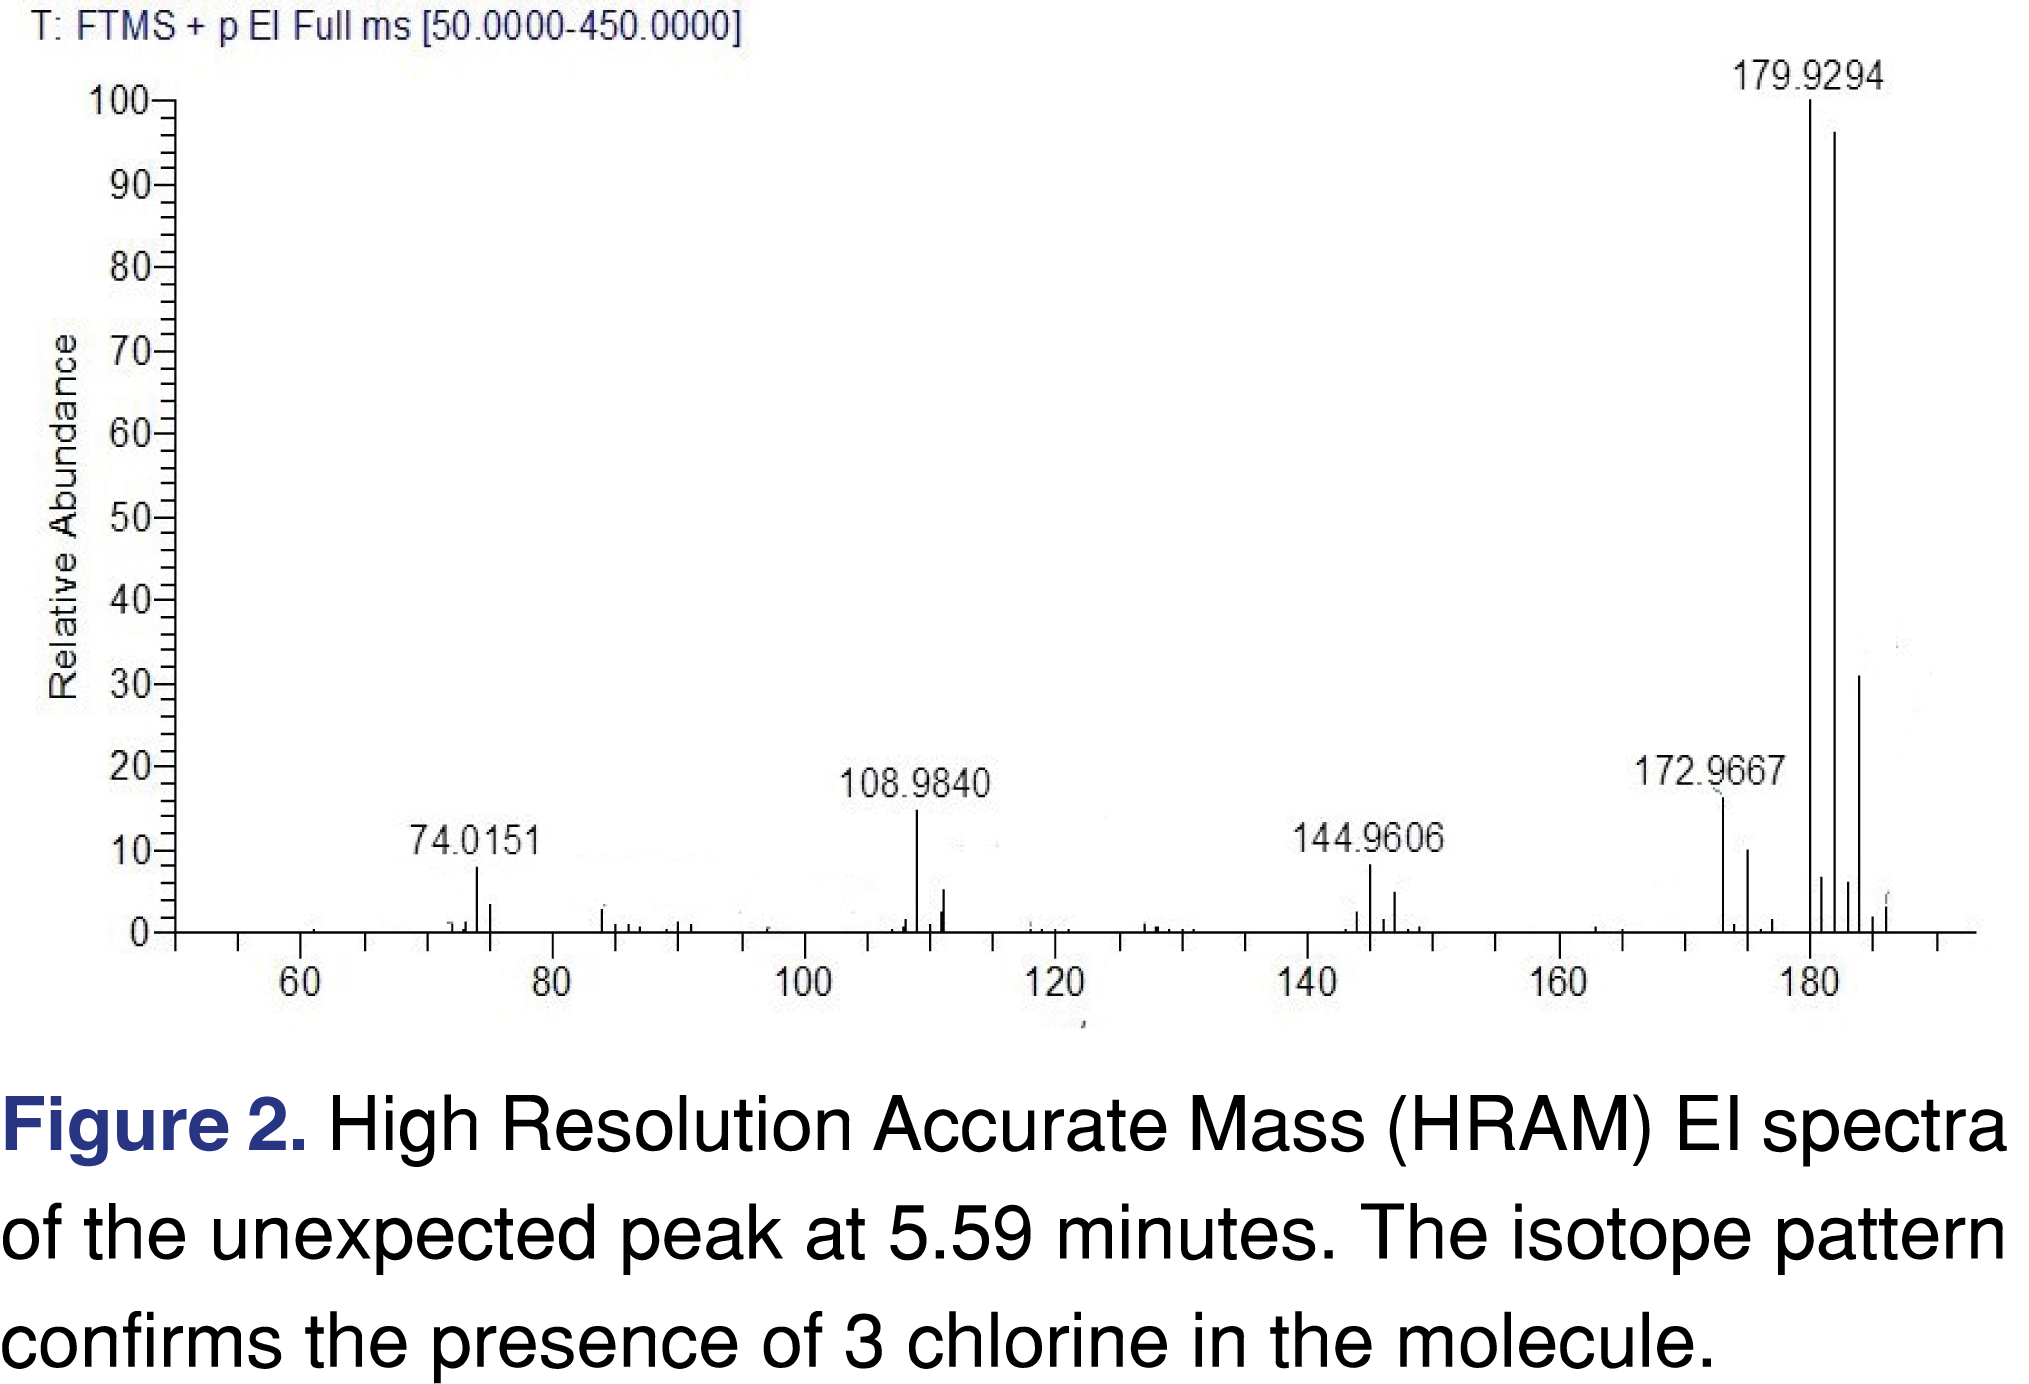
It would be wise if an analytical test method at the leachable AET limit were used to test the finished product before it is packaged and set-up for the leachable stability testing, otherwise there is a possibility of unexpected, unknown peaks leading to investigations during stability testing. The case study presented below is related to a parenteral drug formulation with a calculated AET of 0.009 µg/mL or 1.5 µg/day. Leachable stability was initiated with 3 different manufacturing lots and multiple units were tested at each time point for each lot. A bulk lot that had not been packaged was used as a control to understand if the detected unknowns might in fact be leachables from the DP packaging. From the leachables perspective, everything looked “normal” and no concerning events were observed for two lots. However one of the manufacturing lots showed a couple of “unusual” peaks at or above the AET level. Figure 1 shows the total ion chromatograms of the bulk sample and the stability leachable sample. The sample was spiked with a recovery standard at the AET level of 9 ng/mL, to demonstrate, that the analytical method has sufficient sensitivity to detect impurities at or below the required AET level. The unexpected peak was identified as a halogenated organic analyte. The origin of the peak was related to cross-contamination from a different manufacturing campaign. The ID of the peaks cannot be disclosed due to client confidentiality, however, the mass spectra are presented in Figure 2, to show that even at such a low level, a high-performance screening method can provide high-quality EI spectra for identification purposes.
In this particular case, the screening method had sufficient sensitivity to detect unknown peaks at low parts per billion level and to allow identification of the impurities and their source. The conclusion was that this observed unexpected peak was not related to any packaging components. This approach may not be successful all the time, as certain impurities may not be extracted and/or ionized well under general conditions and therefore may not be detected and evaluated at such a low level.
2.4.2. Impact of the Analytical Conditions on the Relative Response Factor (RRF)
The analysis of reference standards may be performed to enhance the qualitative and quantitative data generated by non-specific screening methods utilized in extractables studies performed on pharmaceutical contact materials. The establishment of a database containing relative response factors obtained from a wide range and variety of standards has not been extensively published, however in recent years several papers [12,14,15,30], conferences [16], and webinars [31] have attempted to “clear the mist”. Those publications provided detailed information on how a particular laboratory generates database(s) and provided a basis for discussion of a common industry practice [15].
After examining the details of those papers closely, it is clear that the different laboratories are using different approaches to create databases, as they use different reference compounds ([14] acetophenone-d5), ([12] 2-FBP), ([18] 2-FBP, d21-BHT and d10-pyrene). In addition to the fact that proprietary response factor databases are using different reference standards to calculate the relative responses, laboratories are using different instrument platforms as well, varying from the most common single quadrupole to Triple Stage Quadrupole and GC-Q-ToF or GC-Orbitrap (HRAM based) [18], and the effect of the different platforms has not been discussed in great detail [17]. Additionally, parameters such as sample introduction to the GC, which may have a significant impact on the relative response factors are not standardized. If at some point the industry moves forward to standardize the generation and limitations of such databases, it would be wise to take into account these factors as well.
The other important factor which has not been discussed in detail before is the evaluation level of the standard components being analyzed when database records or response factor values are determined. As most analytical chemists are aware, MS detectors do not have an infinite linear range and therefore do not have an infinite linear response. If the reference compounds are injected at a low level (or above the detector’s saturation level), the RRF values may be impacted. In the past, when the majority of E&L studies were performed at the ppm level, which is the comfort zone for most laboratories, it was not an issue. However, with the industry moving towards large volume formulations, laboratories are facing extreme challenges from AET levels as low as single-digit ppb. This may be a problem for database generation, as database records will have to be maintained at multiple levels, including levels close to the system’s detection capability. This paper presents some examples where relative response factors vary based on the evaluation level and the injection technique being used. The presented data is generated based on a few selected chemicals, with the intent of facilitating a conversation.
2.4.3. Impact of the Evaluation Level on the Relative Response Factors
The most common practice for database development, as presented in papers [16] and talks [31] is to use a single IS at a single evaluation level, along with RRF database entries generated at the same or similar concentration as the IS or in a concentration range around the IS concentration [14]. The single publication which analyzed a range of concentrations used a 10-40 ppm IS level, which provides excellent peak response and no interference from the analytical system. Analytes for database entries are also injected around that level, with the RRF for the analyte calculated based on the equation presented [16].

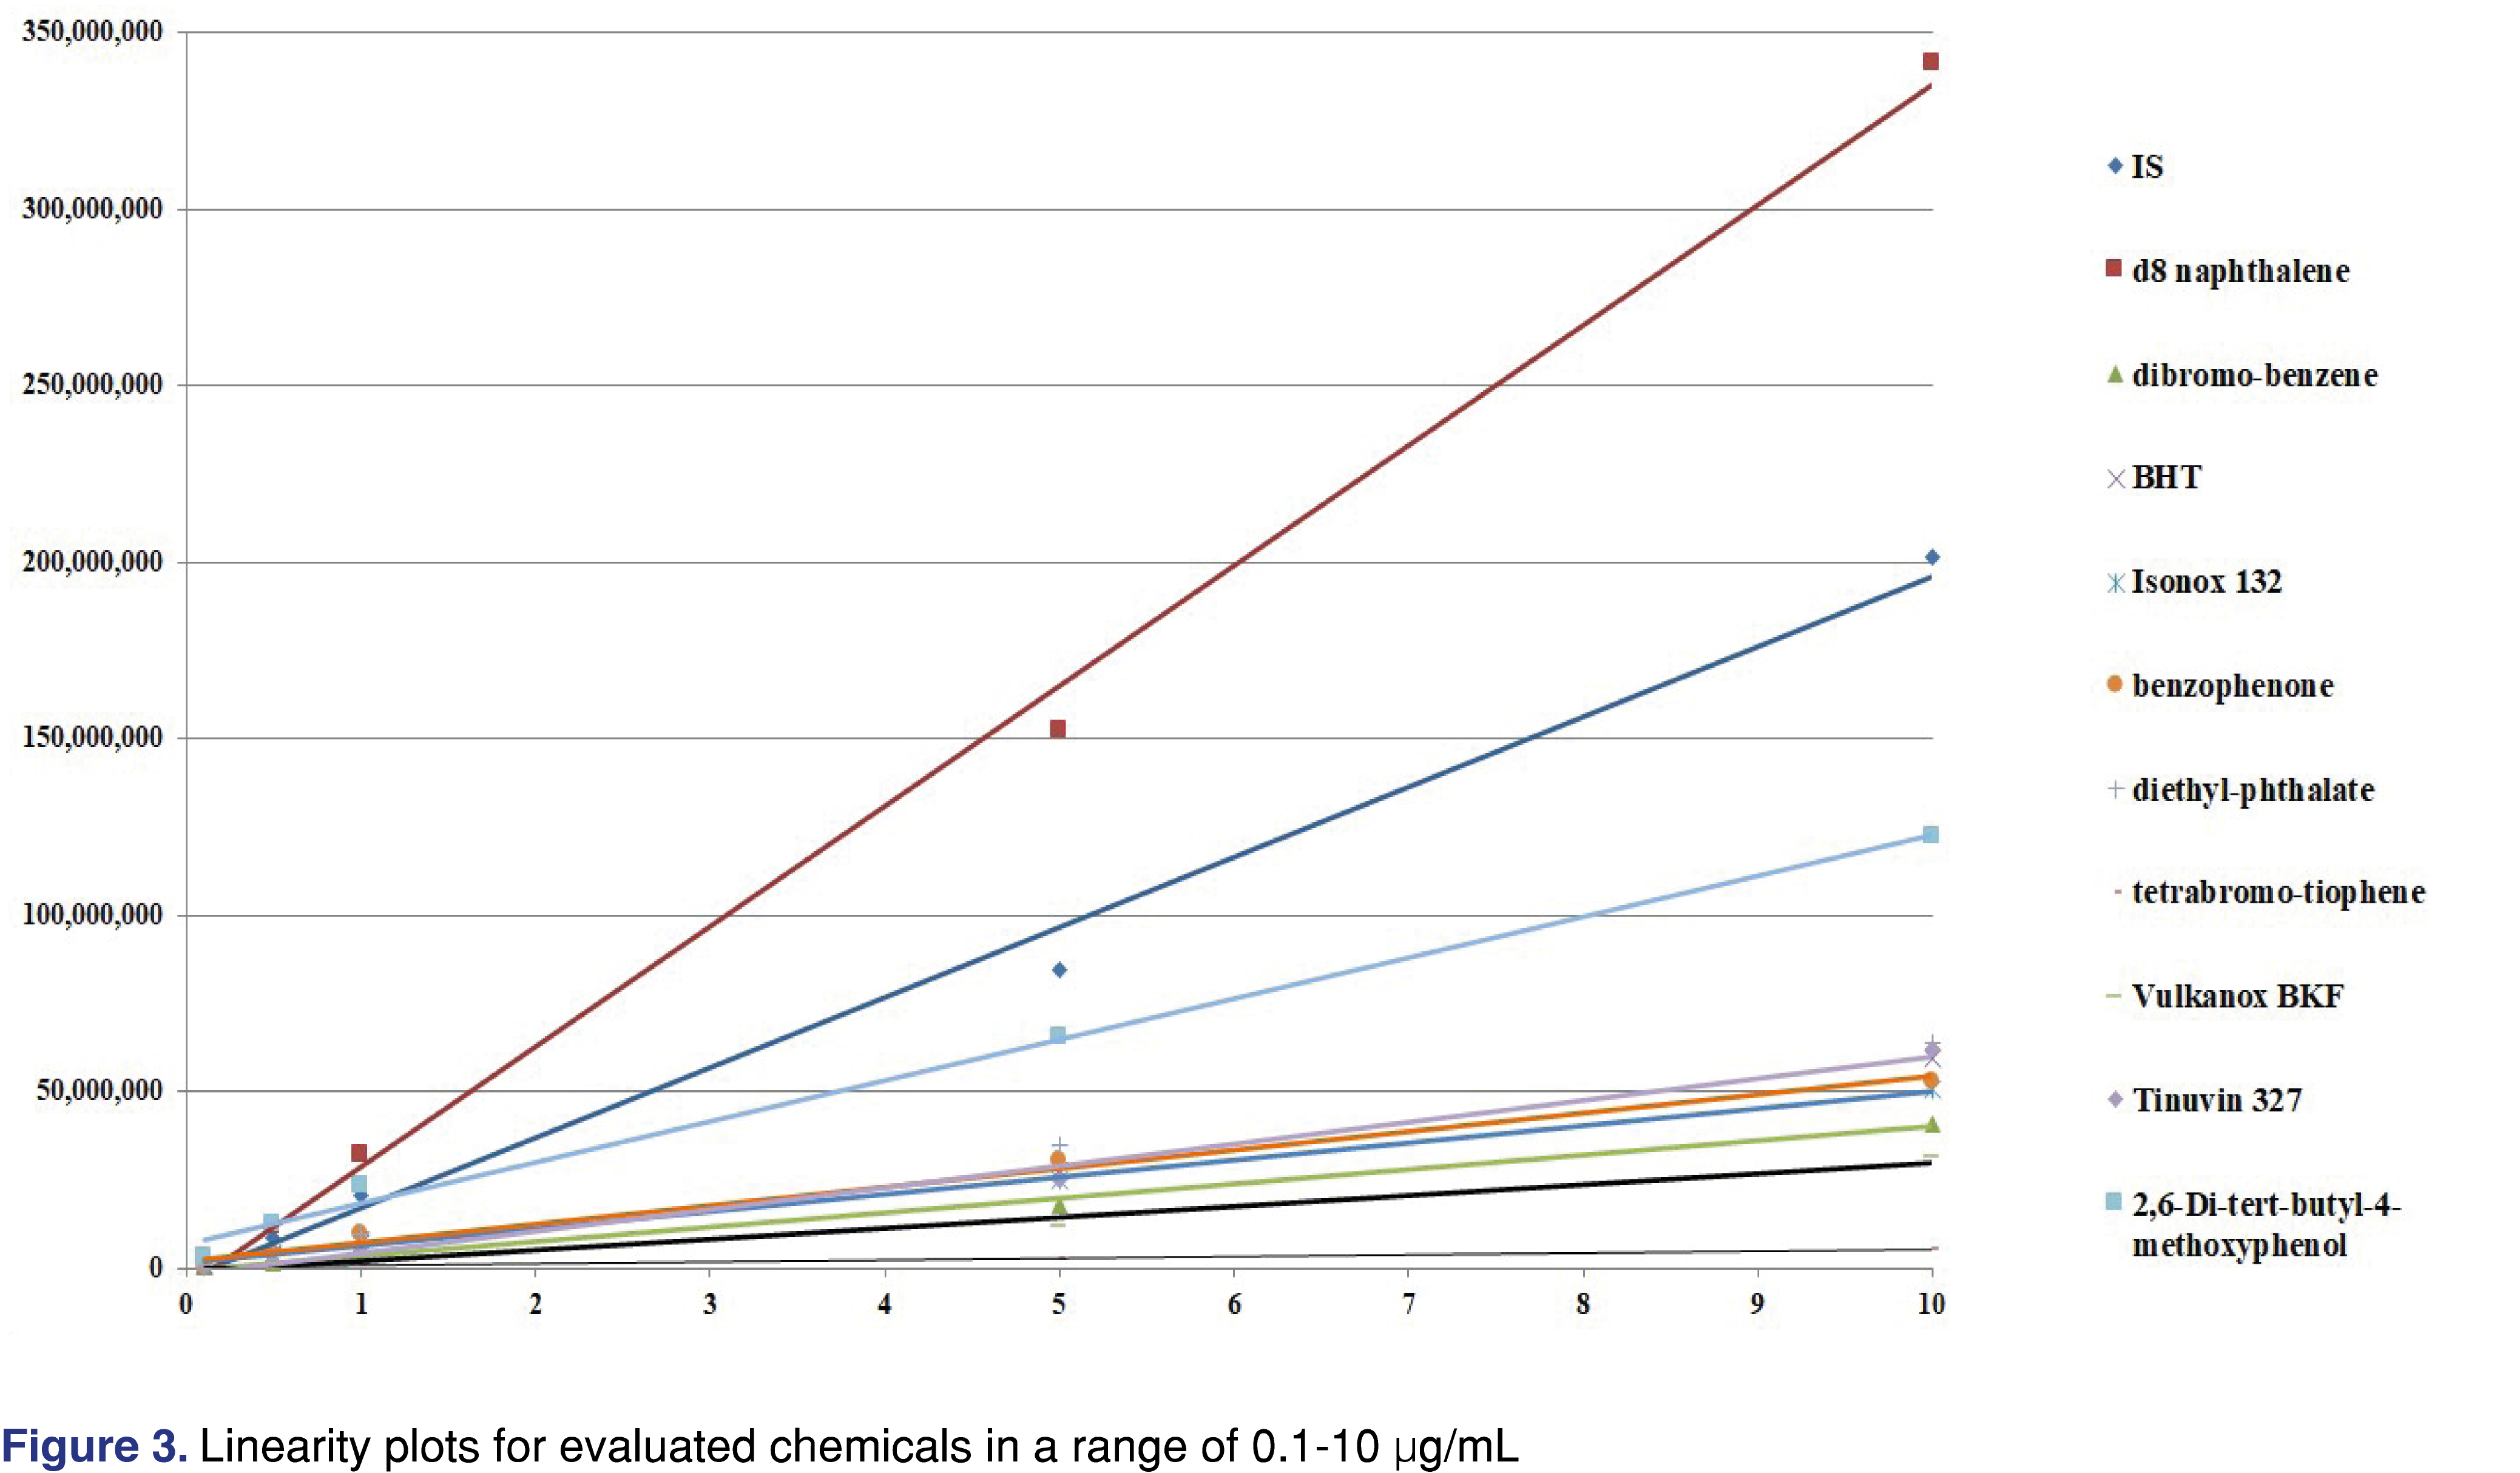
In our experiment, we set up a range from 0.1-10 µg/mL for both the IS and the analytes and evaluated the response factors. It can be noted that this range of targets present at lower concentrations (at the low end) as compared to the data sets published earlier. We expected differences in the RRF at each concentration level, as different chemicals have different slopes for the curve of response vs. concentration as presented in Figure 3.
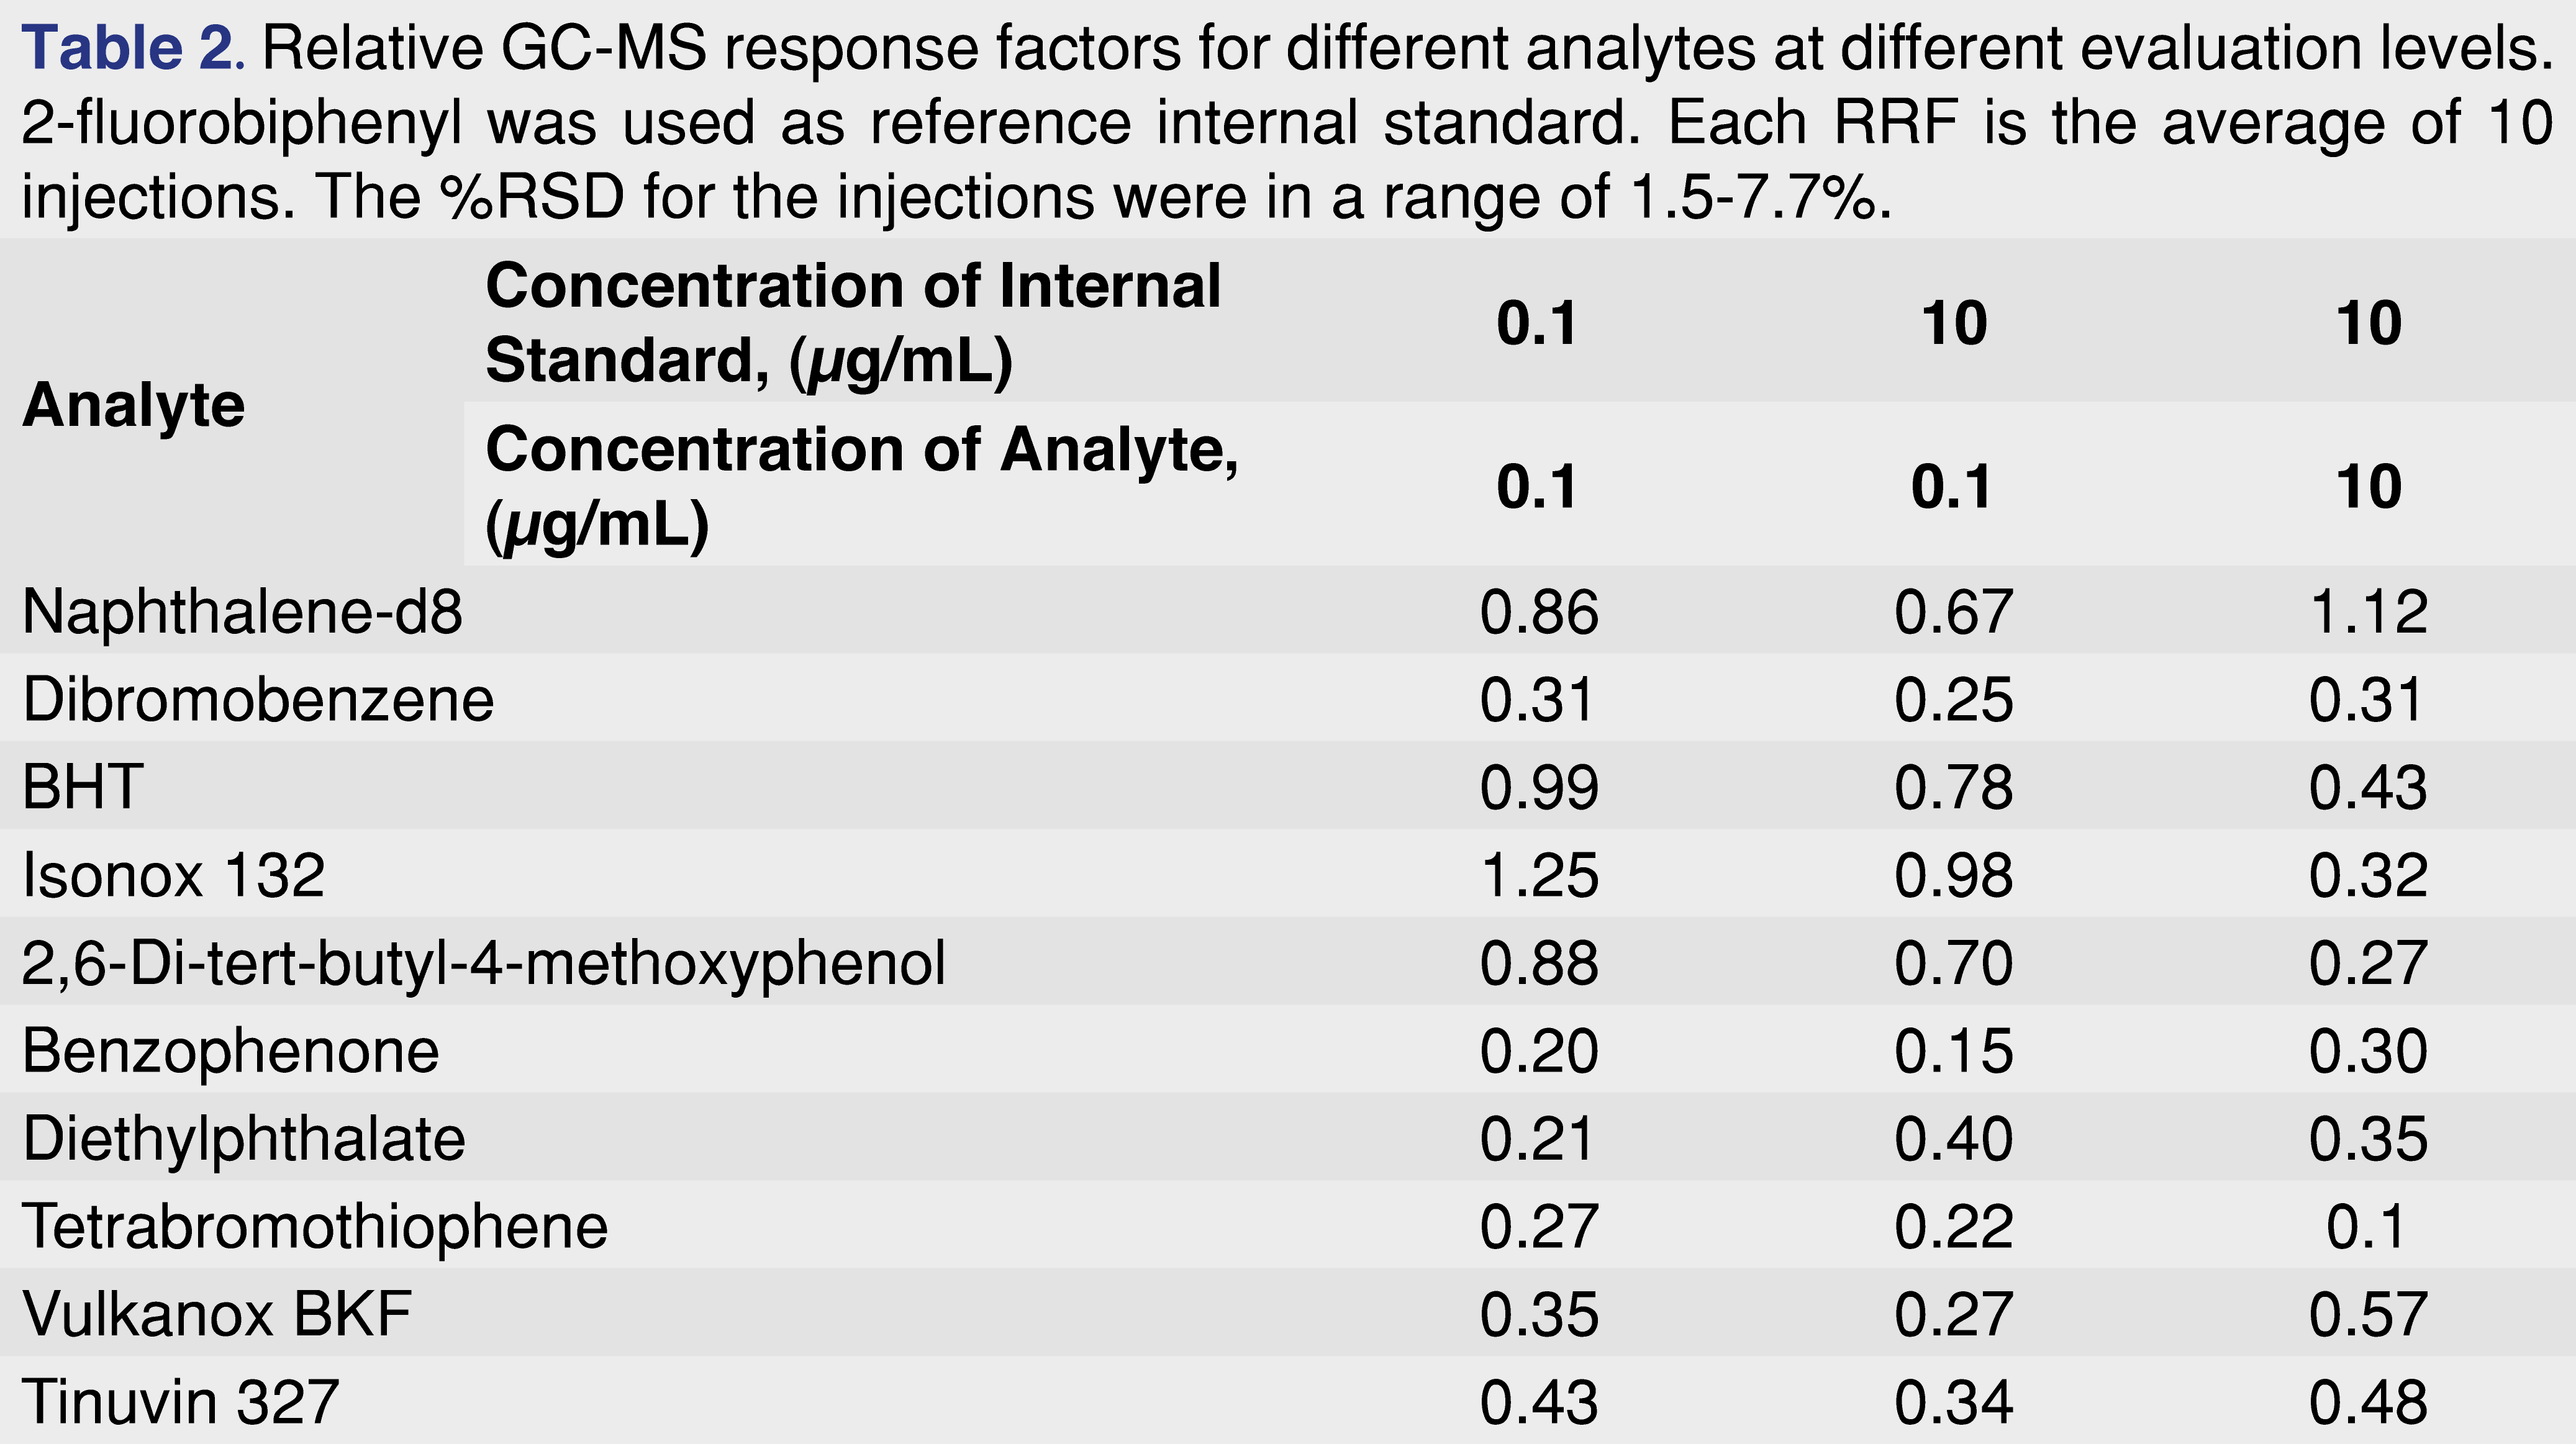
Based on the data presented below the authors suggest that RRF values need to be determined over a range of concentrations, and if linearity is established over that range, use the slope of the curve for the RRF determination. This approach would make the database more robust; however, when it is used for quantitative assessment, it should be within the evaluated range. Table 2 shows the variability of the relative response factors as a function of different sample and standard concentration. The data was generated from solutions made by serial dilution from a working stock, and analyzed by a single analyst on a single day using the same analytical system and method conditions for all injections. The instrument was fully qualified for cGMP use and the data collection system meets the expectations of data integrity requirements. All of the peaks were baseline separated, and even at the lowest concentration level, the signal to noise value observed for the lowest intensity peak was higher than 100:1 in scan data acquisition.
By looking at this data set one might question why a laboratory would use the IS at a different concentration than the analyte? There is a practical answer for this. From laboratory operation aspect, it is more effective to default to a “one size fits all” method where the IS is spiked into each sample at the same level without consideration that different products have to be evaluated at different levels (for example a 5 ppm IS spike used across multiple projects even when the calculated AET is at 0.1 µg/mL for one platform and 10 µg/mL for another one). When the industry moved toward large dose formulations, the very low AET levels became common, and in some cases, the AET is close to the known limitations of the detection capability of the instrumentation. Those issues are not present when the AET was near 100 ng/mL level since peaks were clearly visible even in scan data acquisition. However, at a lower level, it may be a problem when the laboratory is dealing with lower intensity signals. The purpose of the screening method is to provide objective evidence to the regulatory reviewer that all peaks are being detected and evaluated at the AET level. One of the most practical ways to provide evidence for that is to spike the samples with the internal standard (or recovery standard) at the AET level. If the spiked IS or RS is clearly visible at the AET level, it provides some level of confidence that the method and the instrumentation is fit for the purpose. However, based on the presented data set, the RRFs for different analytes show relatively high variability if the IS is used at different levels, and it may raise a question when a database was created as to what level of standards was employed. We cannot claim that one practice is better than or superior to some other approaches; however there are practical reasons why the internal standard is being used at the AET level by our laboratory, which sometimes corresponds to an exceptionally low level in the case of large dose products.
Figures and Tables
[Click to enlarge]
2.4.4. Impact of the injection technique and data acquisition parameters
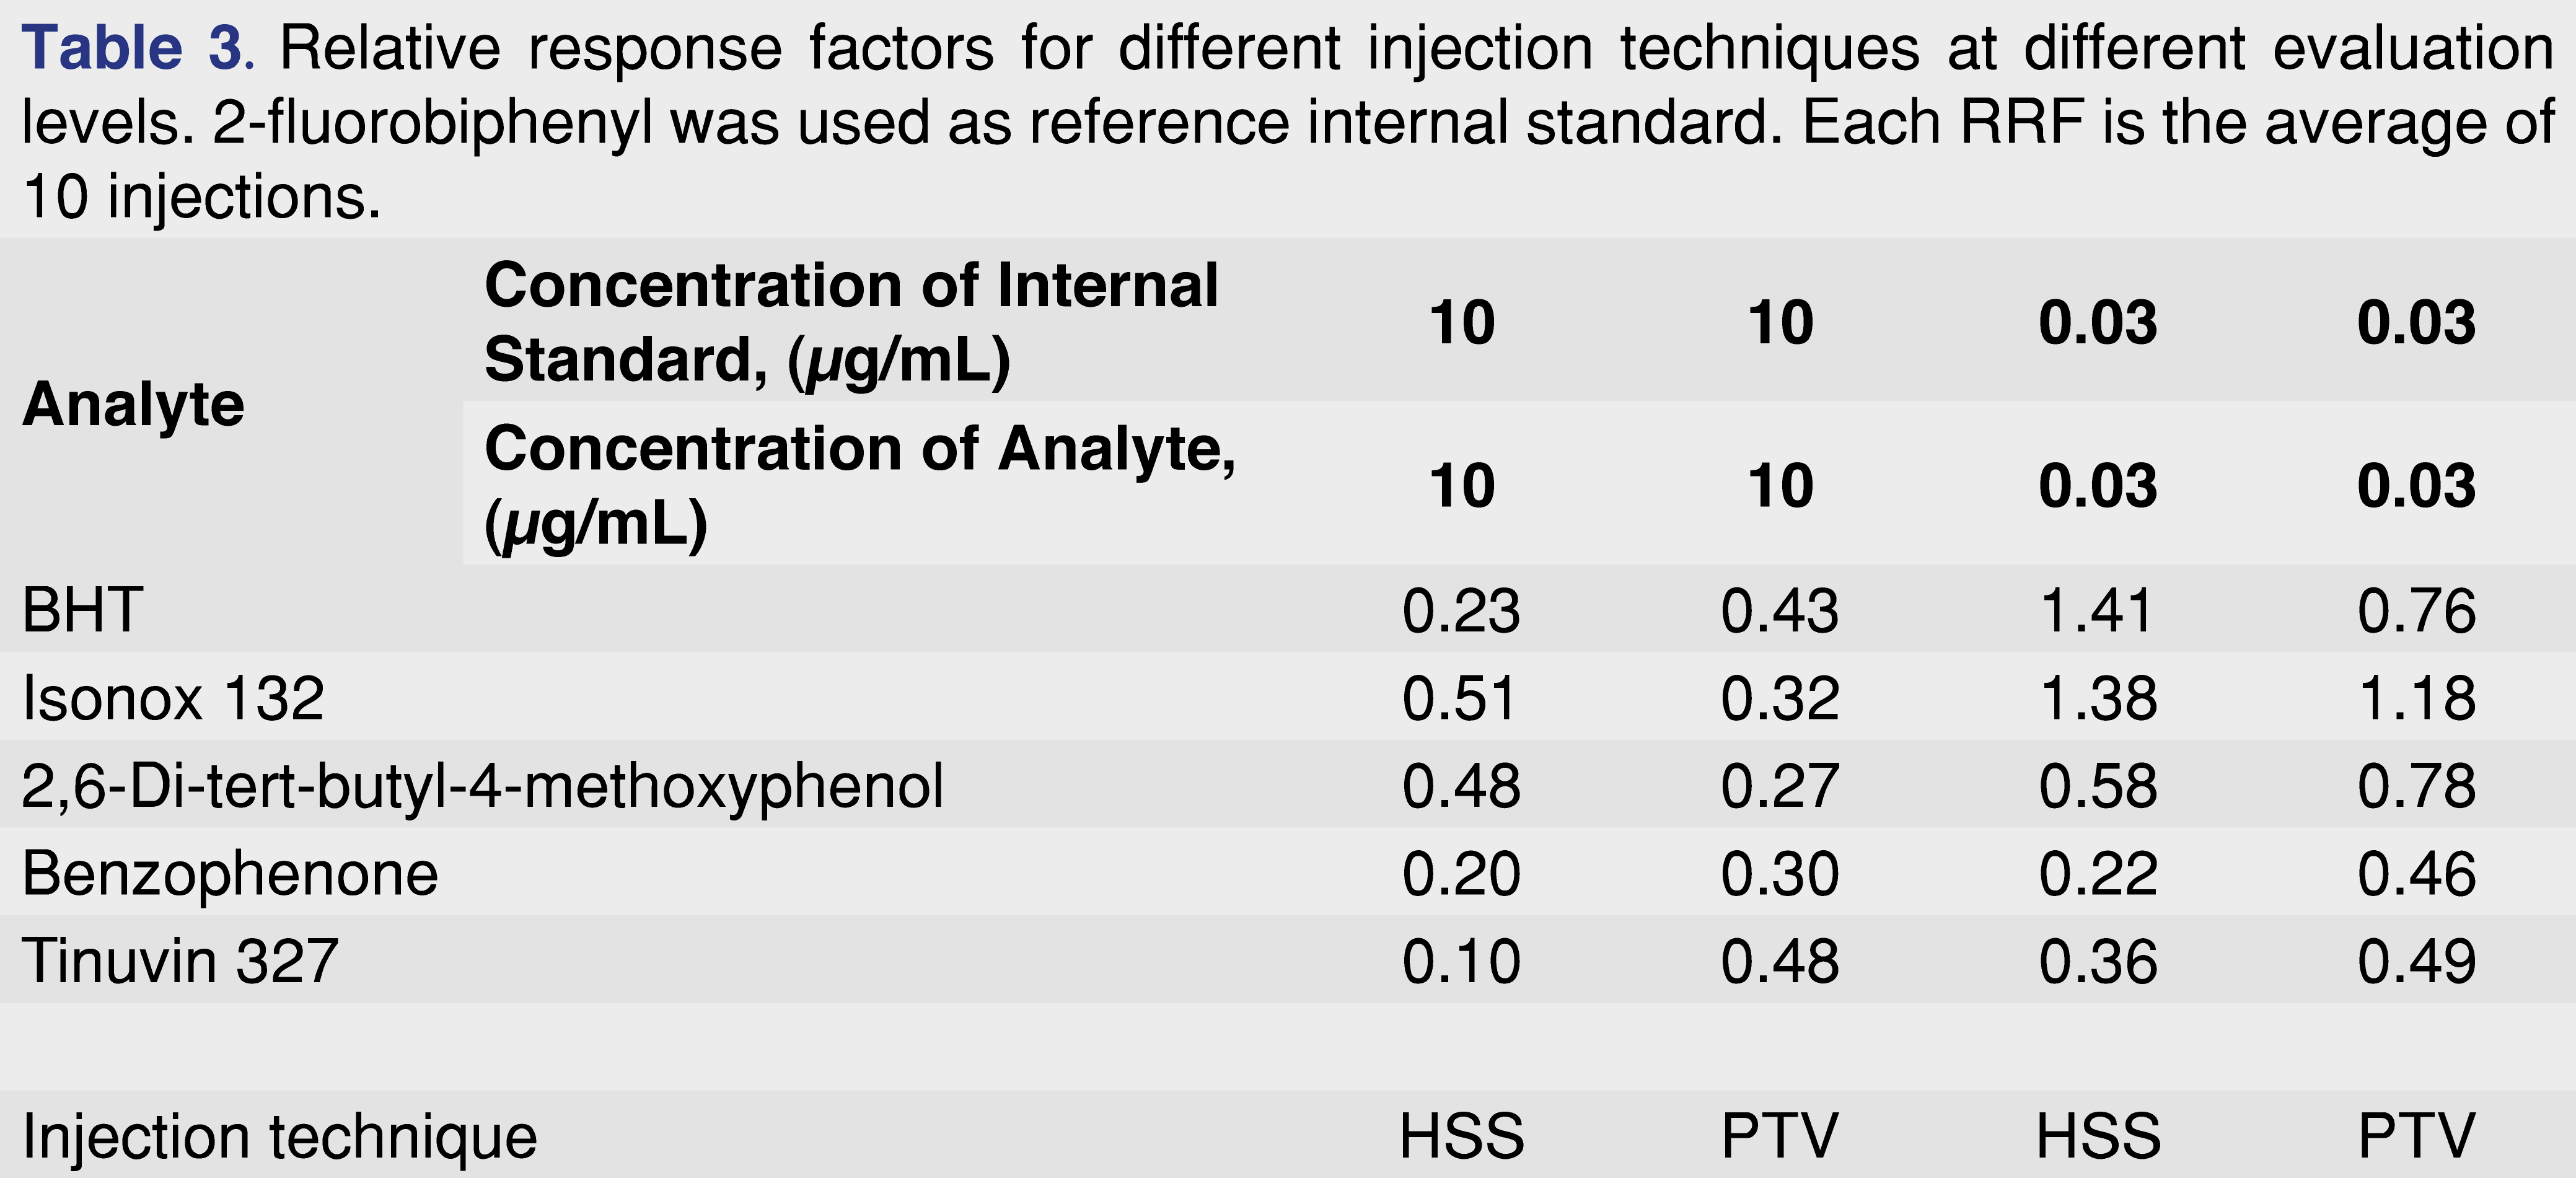
There are many practical aspects of using “standardized” methods for E&L evaluation, and the majority of cases can be covered with standard and unified methods. However, it is the author’s opinion that such a method will not be implemented industry-wide in the near term [17]; there would be practical limitations of use since E&L studies are covering a wide range of materials, matrices, and concentration ranges. For GC-MS testing, one of the critical variables of the sample analysis process is the injection. The injection process will determine how much of the analyte will reach the column and be detected at the end of the process, and has a significant impact on the peak shape and intensity [27,28]. The injection process includes consideration of the sample solvent, the injector geometry, and the injection parameters. Unfortunately, the injection process can discriminate between analytes based on their boiling points, as compounds with high bp are not transferred effectively to the column [27,32]. Most of the laboratories in the E&L field use a “standard” HSS injector, which has a known discriminative effect. Only a few laboratories use the more advanced (more expensive with more controllable parameters) PTV injector, which was developed to reduce the discriminative effect of the HSS injector, and is, therefore, suitable for a wider range of analytes. The intention of this paper is not to recommend one injector over another; however, the presented data indicate that the injection technique has an impact on the RRFs, and ideally when an RRF database entry is generated, it should be noted what sample introduction was used, allowing the reviewers to make decisions regarding confidence in the quantitative estimate for a particular leachable. Based on our experience, “problematic” components such as benzophenone and Tinuvin 327 have fewer injection issues and generate more reliable data using PTV injection technique. It is interesting to see the more commonly used HSS injection technique resulted in RRFs in a range of 0.1-1.41 (combined) while with PTV injection the range is narrower, at 0.27-1.18 (Table 3).
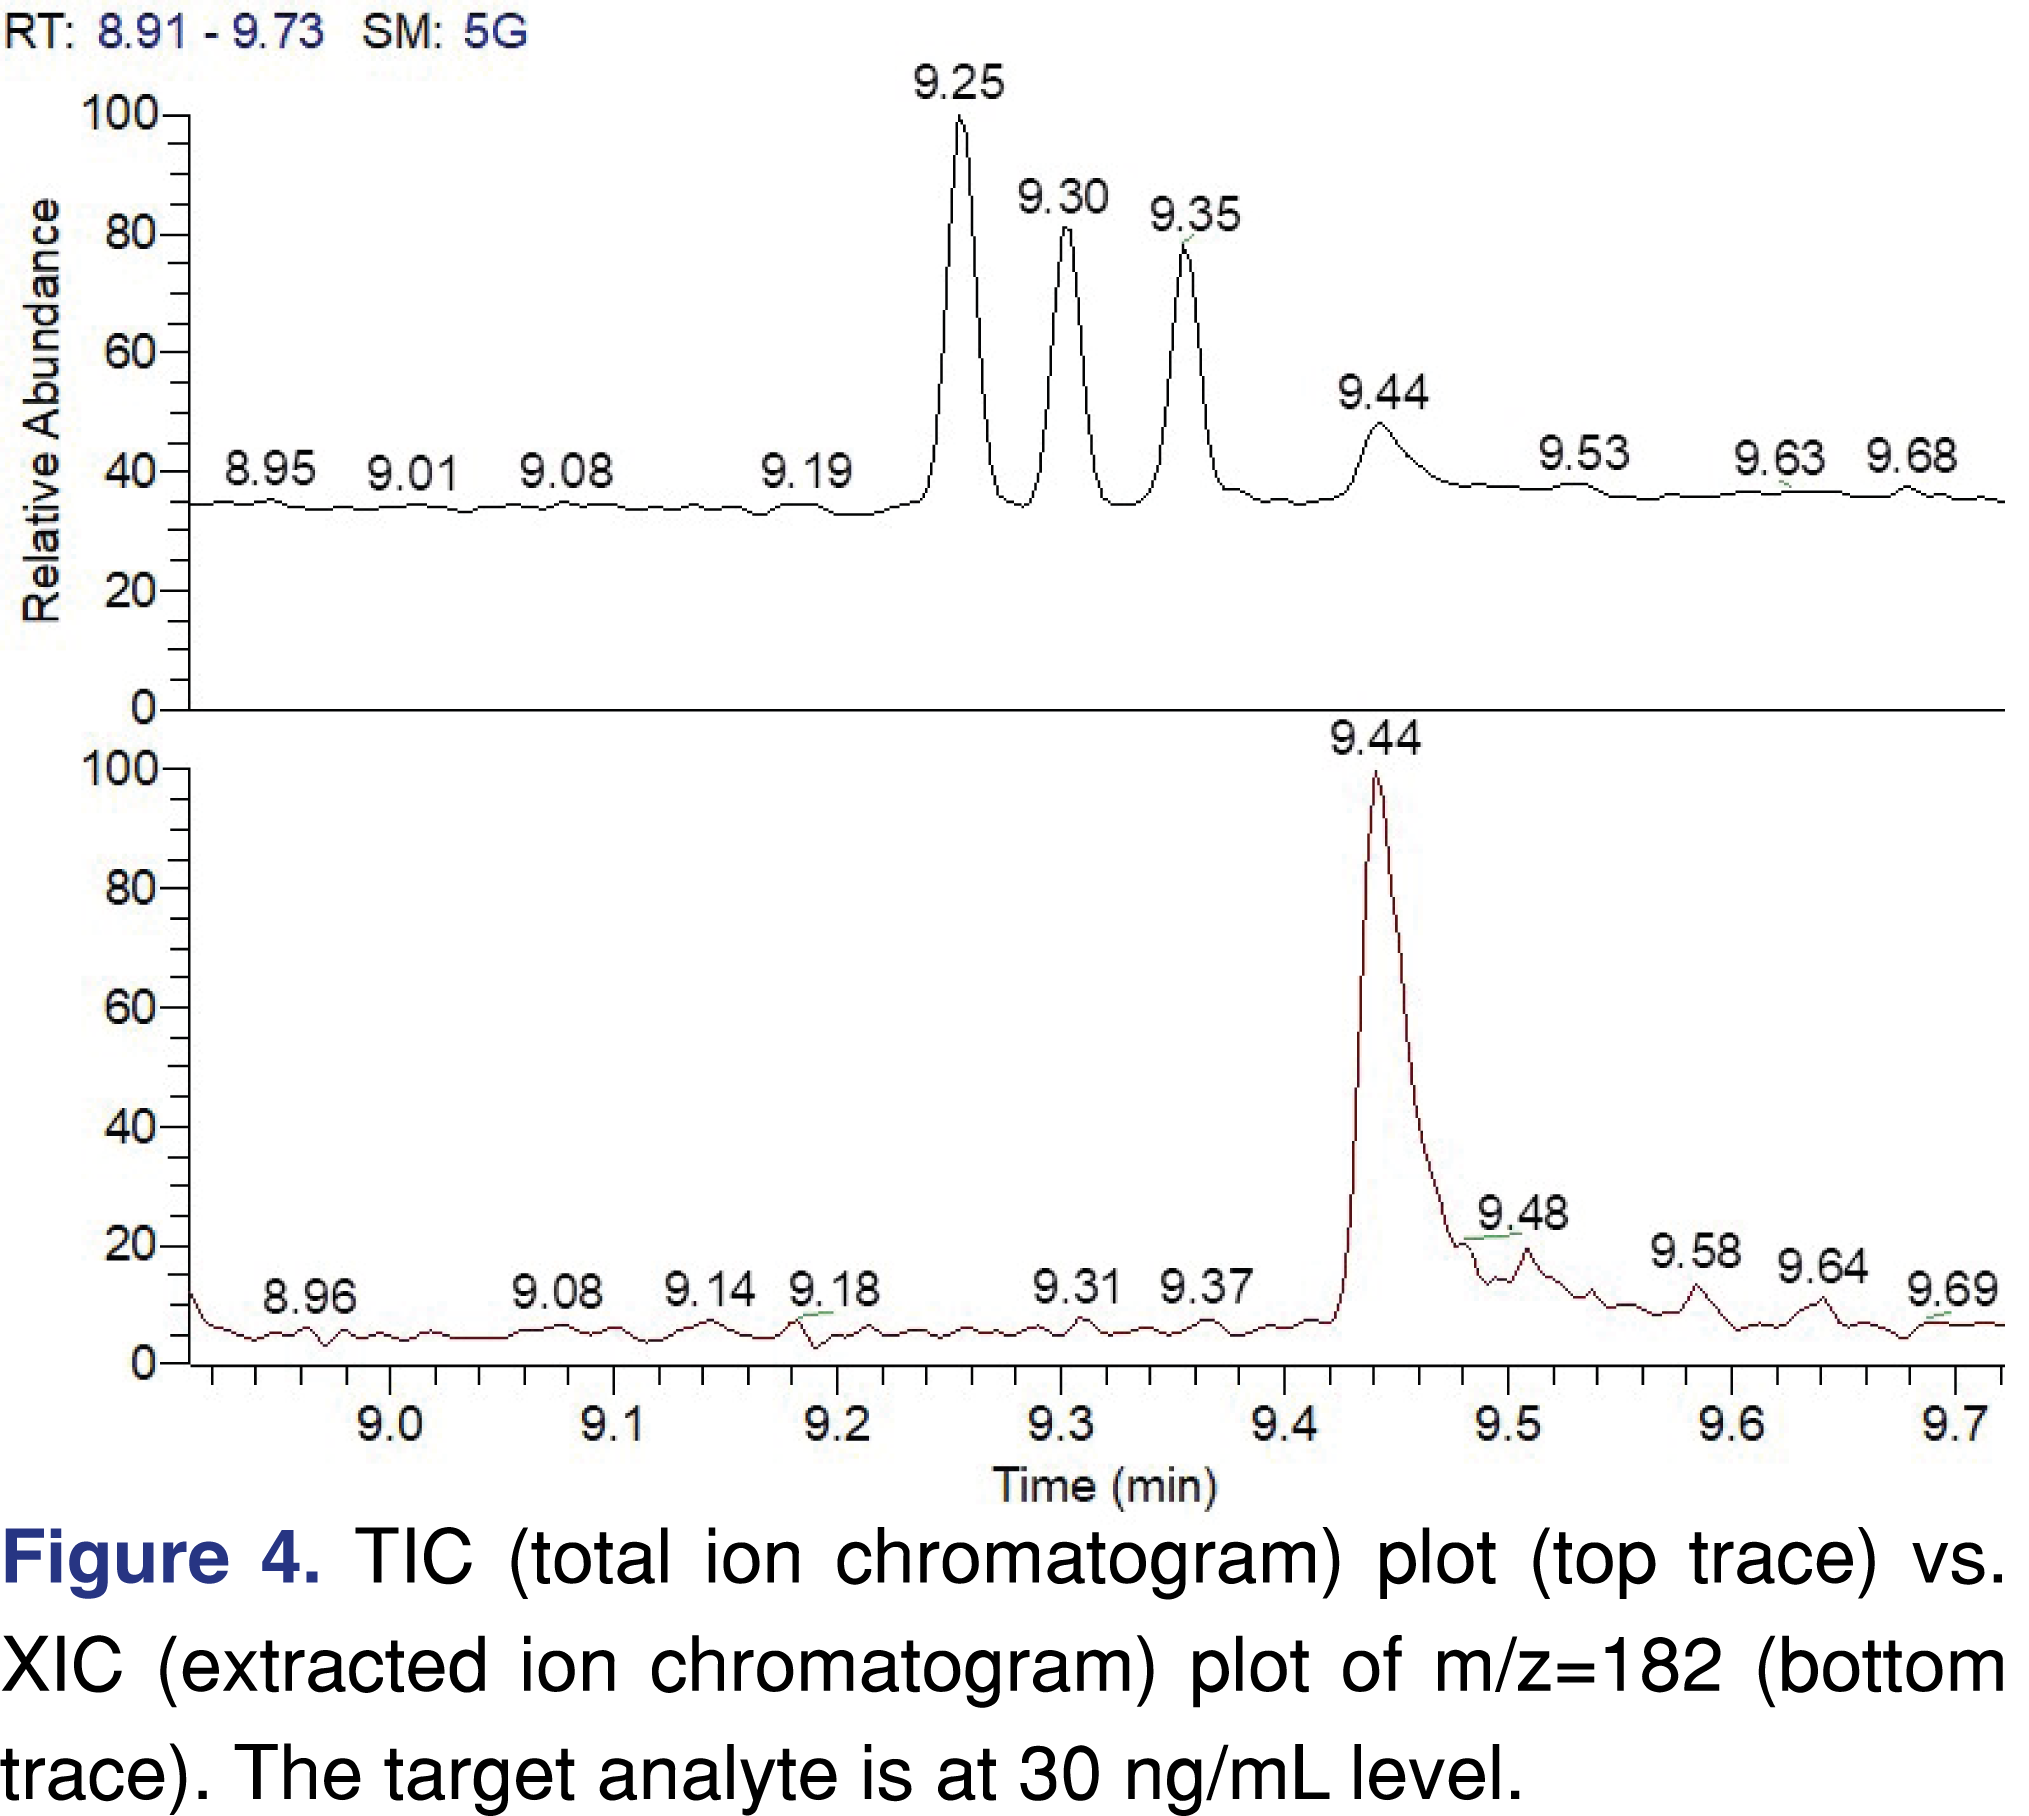
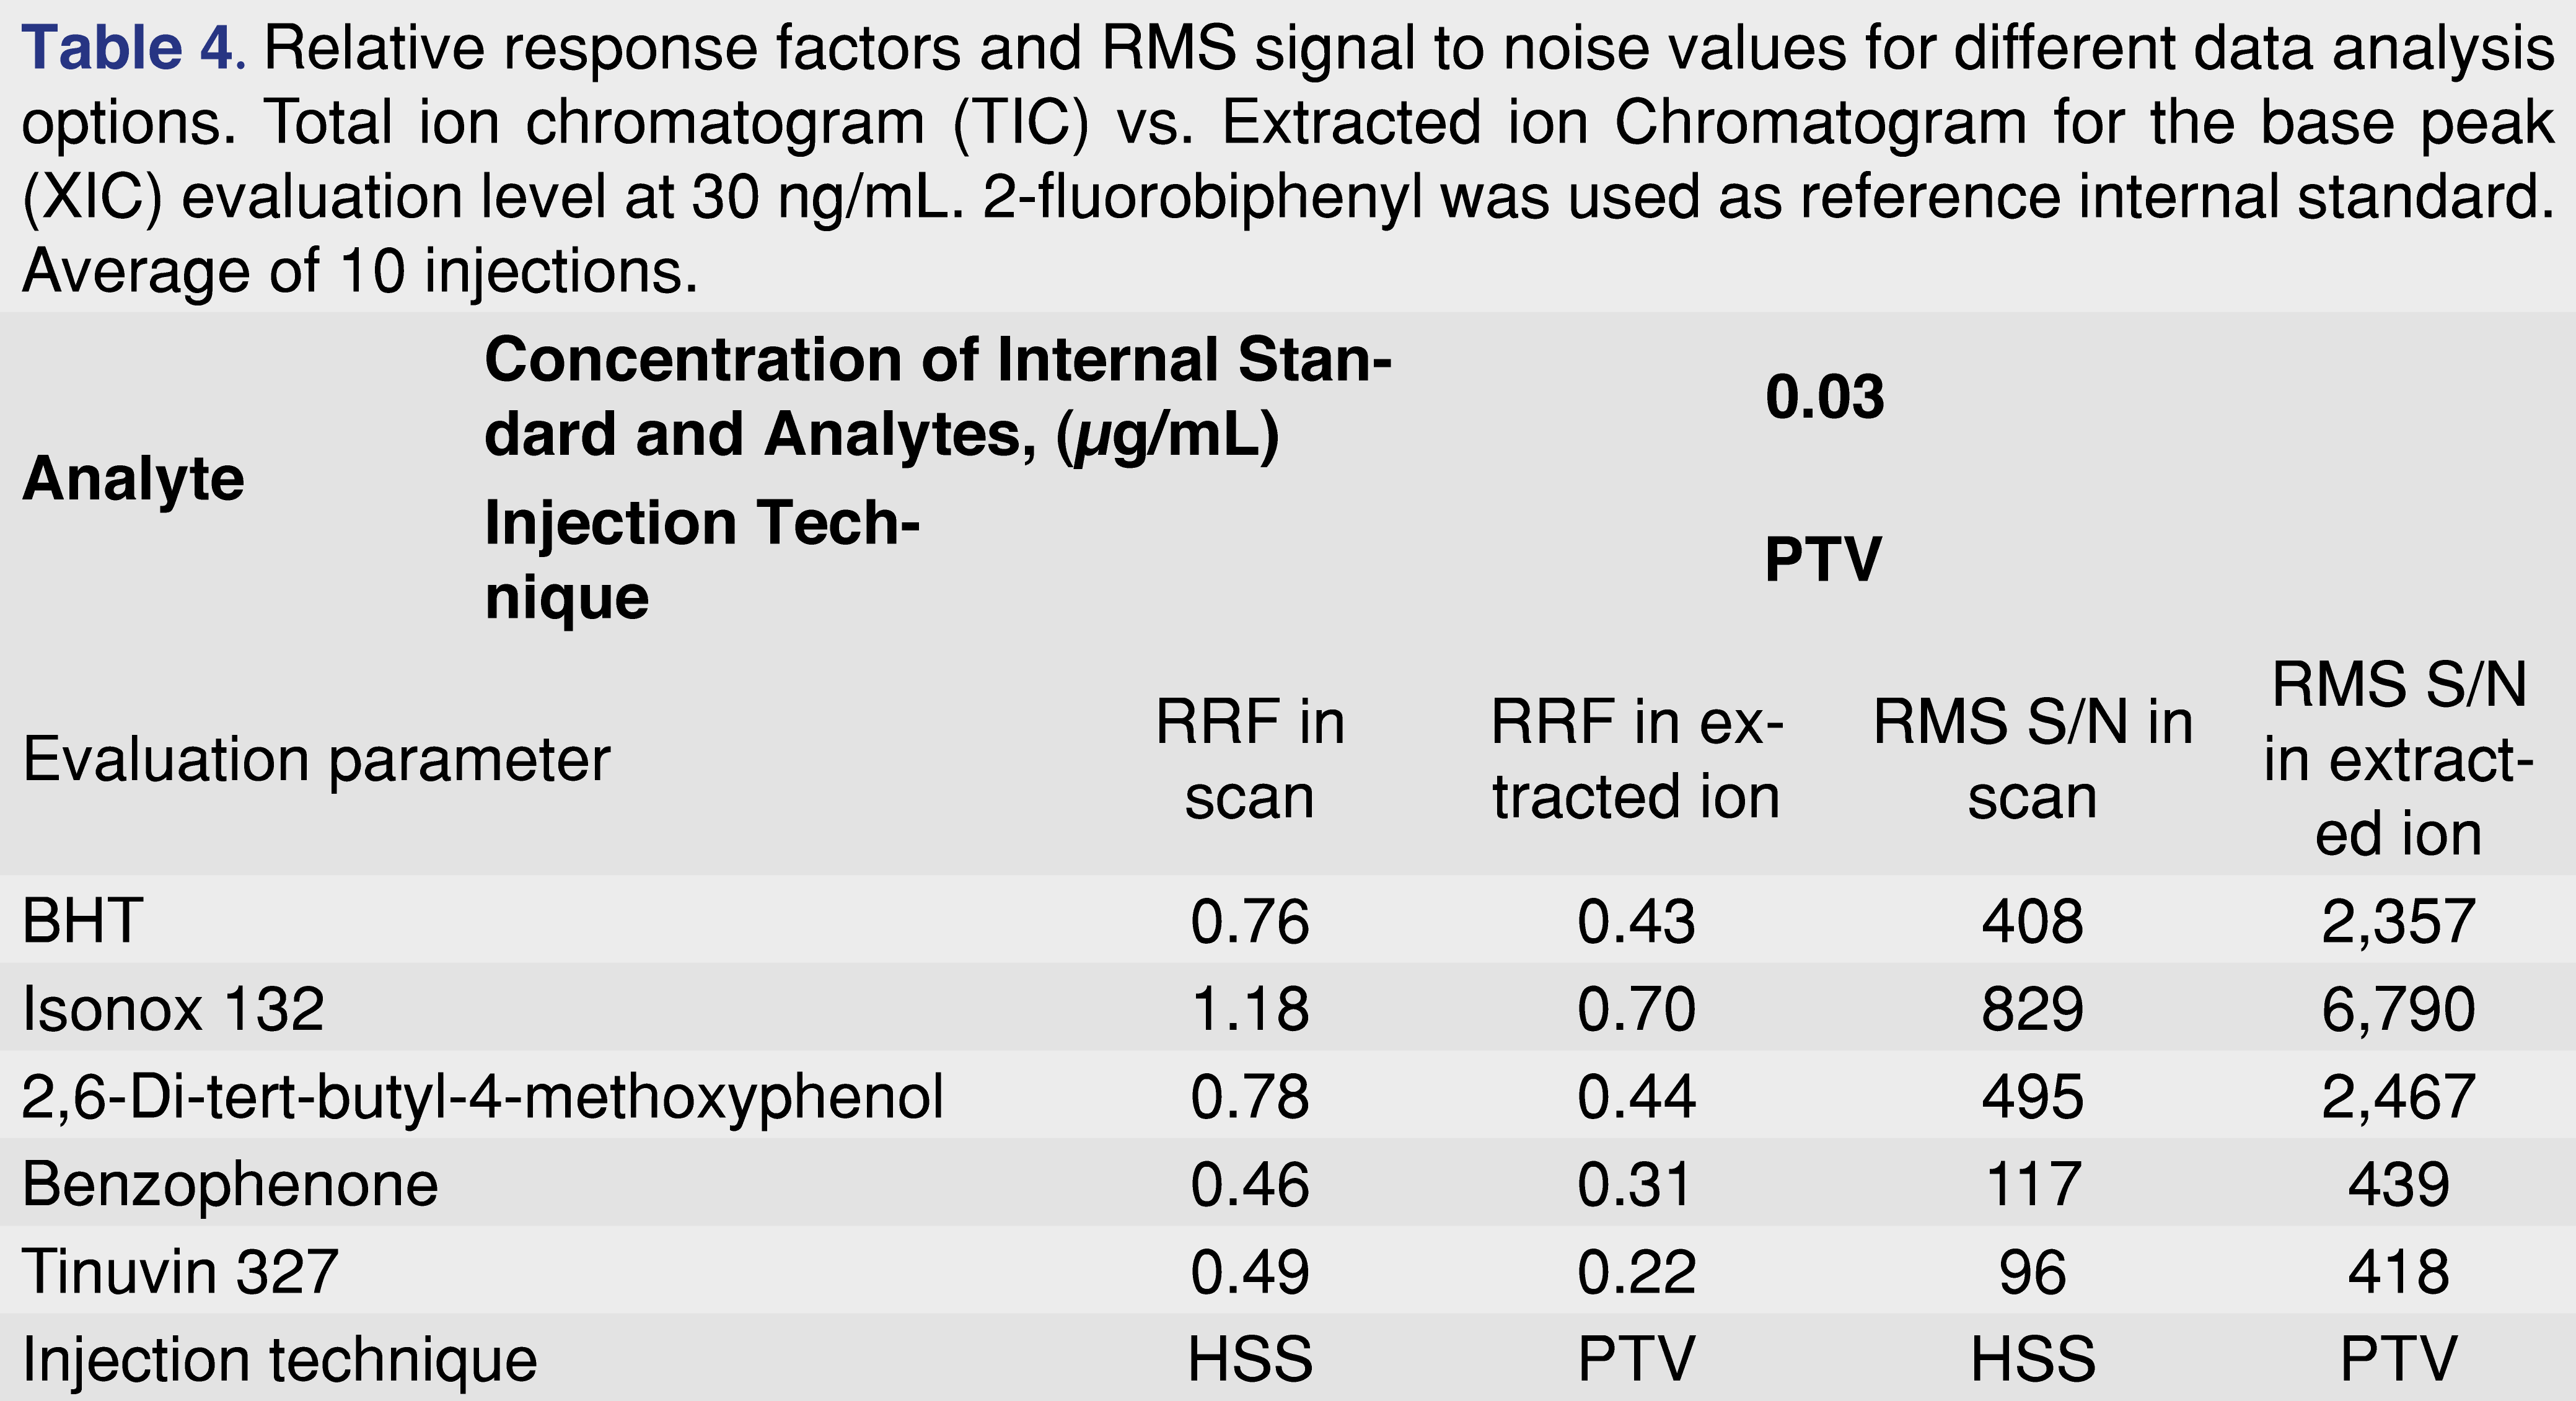
It should be noted that if an RRF database is generated based on TIC data from peak integration performed on the TIC chromatogram, the response factor values may not be appropriate for extracted ion data. Extracted ion traces have less interference and the signal-to-noise ratio is significantly improved, therefore errors in integration are reduced, especially when the peak intensity is near instrument detection limits, as in the example presented in Figure 4. Besides all the substantial benefits, the RRF values are different for the TIC trace versus the XIC trace (see Table 4). The simplest way to tackle this issue, since data is typically acquired in scan mode, is to have two different data processing methods and have two different RRF values assigned to every single chemical.
2.4.5. Impact of the sample matrix of the RRF
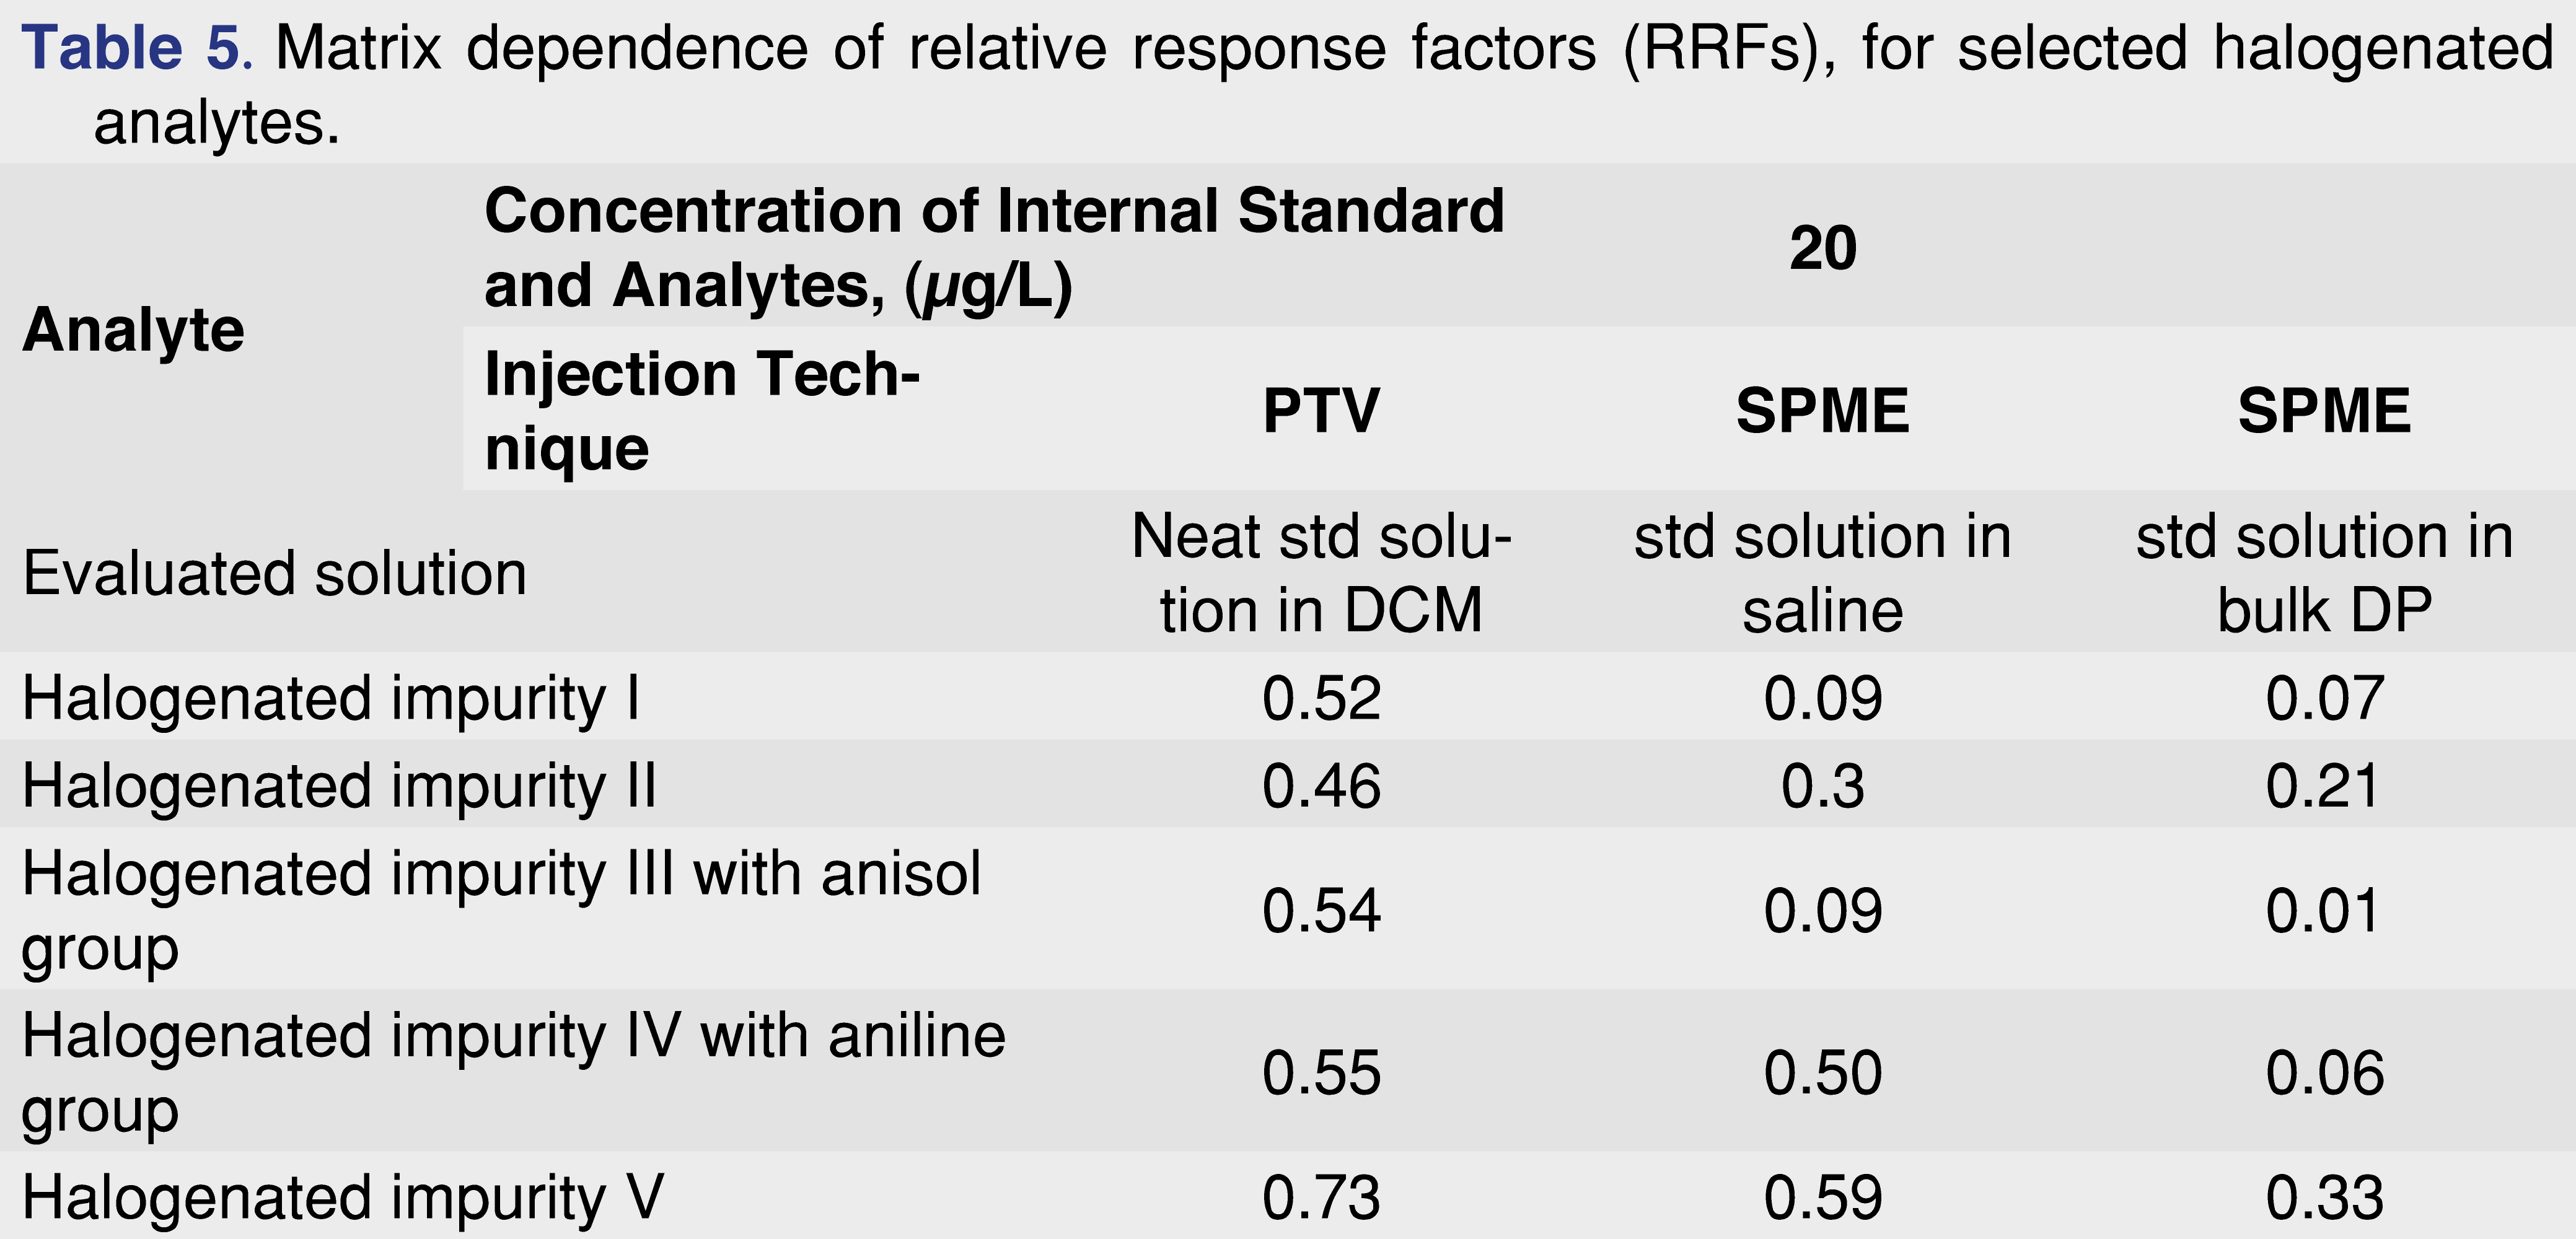
Database records are usually generated using neat standard solutions, which are suitable for providing quantitative estimates for extractables in most cases. However, when the levels of leachables are in question, it is important to pay attention to the way the quantitative numbers have been calculated. A major consideration for finished drug products is that sample preparation is required prior to analysis. Some formulations are relatively easy to process, such as saline with a low concentration of API, while others pose significant challenges (complex polymer-based formulations, presence of Tween 20, high level of API). In all cases, it is necessary to provide a reliable quantitative assessment of all leachables in the finished DP. The following example presents a scenario where the response factors show significant differences between the neat standard injections, standard spiked into saline solution, and standard spiked into the finished DP. The data presented here was performed for the investigation of unexpected impurities, with the goal to investigate if the impurity is related to any packaging material or another source. The evaluation was performed at an AET level of 20 ng/mL, and the target analytes were different halogenated organic species. The standard solutions were prepared in dichloromethane with both the target analytes and the 2-FBP internal standard at the AET level and injected in PTV injection mode. The solutions were also prepared at the same concentration in saline and a bulk DP and injected after a sorbent-based solventless on-line extraction (SPME) in triplicate. The results are presented in Table 5.
The data set presented in Table 5 shows that some of the analyzed species, especially the tri-halo and tetra-halo species, have minimal differences across the studied matrices (approximately 2-fold differences), while the analytes with aniline or anisole functional groups demonstrate 9-fold to 50-fold differences between the standard injection in DCM and the spiked DP RRF values.
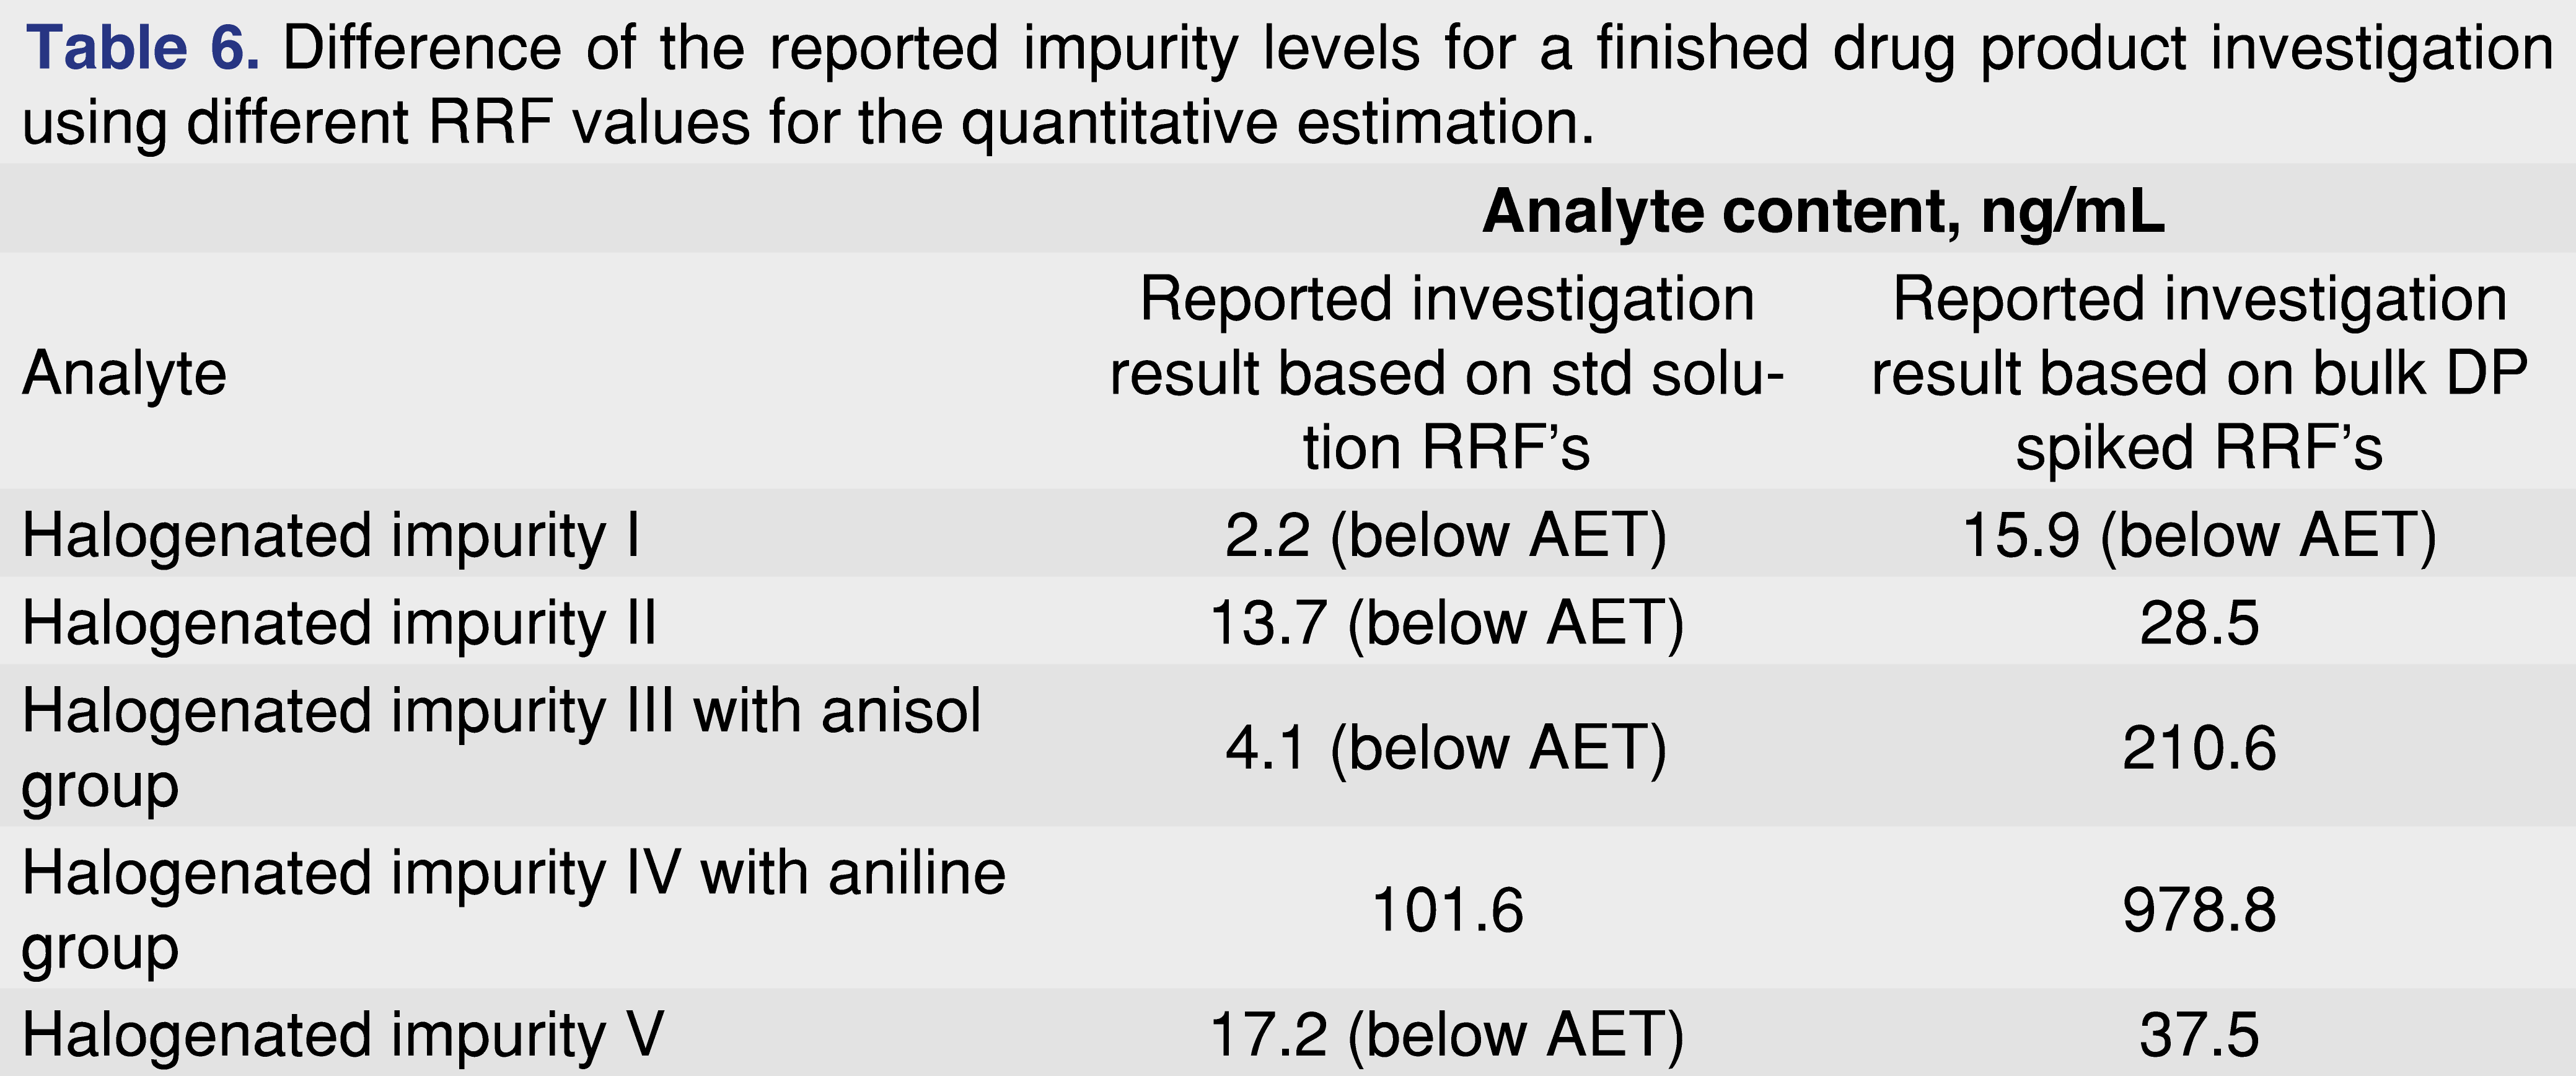
Table 6 shows the reported results of the finished drug product sample for two different quantitation scenarios. In one scenario the response factors from the standard injection in DCM had been used, while in the second case the response factors based on a spiked drug formulation were used. The data presented in the table shows significant differences between the two different quantitation approaches, highlighting the importance of understanding how the relative response factors being used for quantitative evaluation were generated.
2.5. Internal standard (IS) vs. Recovery internal standard (IS/RS) approach for leachable testing
2.5.1 Drug Delivery Device Evaluation
As scientists, we know that all of the reliable laboratories work under similar high scientific standards, and serve clients based on best practices, yet there are (and will be) discussions across the industry raising concerns regarding the variability of data related to E&L data packages. A recently published paper states “there is some evidence, largely anecdotal, that E&L screening results are inadequately accurate and reproducible” [17]. Though we mostly agree with this statement, if rigorous scientific standards are applied, the variation of the data should be explainable. The authors would like to present a case to demonstrate that variability of the data between laboratories can be a result of different experimental approaches. The authors 100% agree that “different methods that are not individually optimized to suppress variation and that are implemented without adequate control” [17] can present large variation between laboratories or even within a single laboratory. The authors also believe that a standardized approach to extractable testing is possible, but uniform leachable testing would be difficult to implement across the industry. From an operational point of view, the “one size fits all” method is a cost and resource-effective model; however, this type of testing cannot address the different requirements for each finished product, including testing a wide concentration range due to different AETs. We have to keep in mind that the majority of the E&L testing laboratories are working for clients, and therefore we have a responsibility to complete projects in a timely and cost-effective manner without sacrificing scientific rigor. On the other hand, E&L data packages are part of the CMC section of the regulatory filing and are rigorously reviewed by a regulatory agency. The testing lab’s responsibility is to present the data in a format allowing the reviewer to make a decision, based on clearly presented objective evidence. A good leachable screening method should meet at least the following two criteria:
Evidence should be provided and presented that the method has a sufficient limit of detection to monitor peaks at the required AET level. This seems obvious, and it is easy to achieve for low dose formulations where the AET is typically 0.1 µg/mL or higher; however, it is very challenging for LVP products with AETs below 10 ng/mL.
Evidence should be provided that the reported data are based on a scientifically justifiable quantitation approach, including how the reporting threshold was derived as well as the manner of quantitation (surrogate-based quantitation or IS/RS based quantitation).
Below we would like to present a case study related to a medical device stability evaluation, where two laboratories used different experimental approaches which resulted in two different outcomes with two data presentation approaches. The subject of the evaluation is the liquid based drug formulation, which was kept in the device over the stability period and discharged at the time of the stability pull. Interestingly, though the reported results are identical for both approaches (as both study outcomes resulted no peaks present above the AET), for one of the approaches it is exceedingly difficult for the regulatory reviewer to understand if leachables are present close to the AET limit or they are much below.
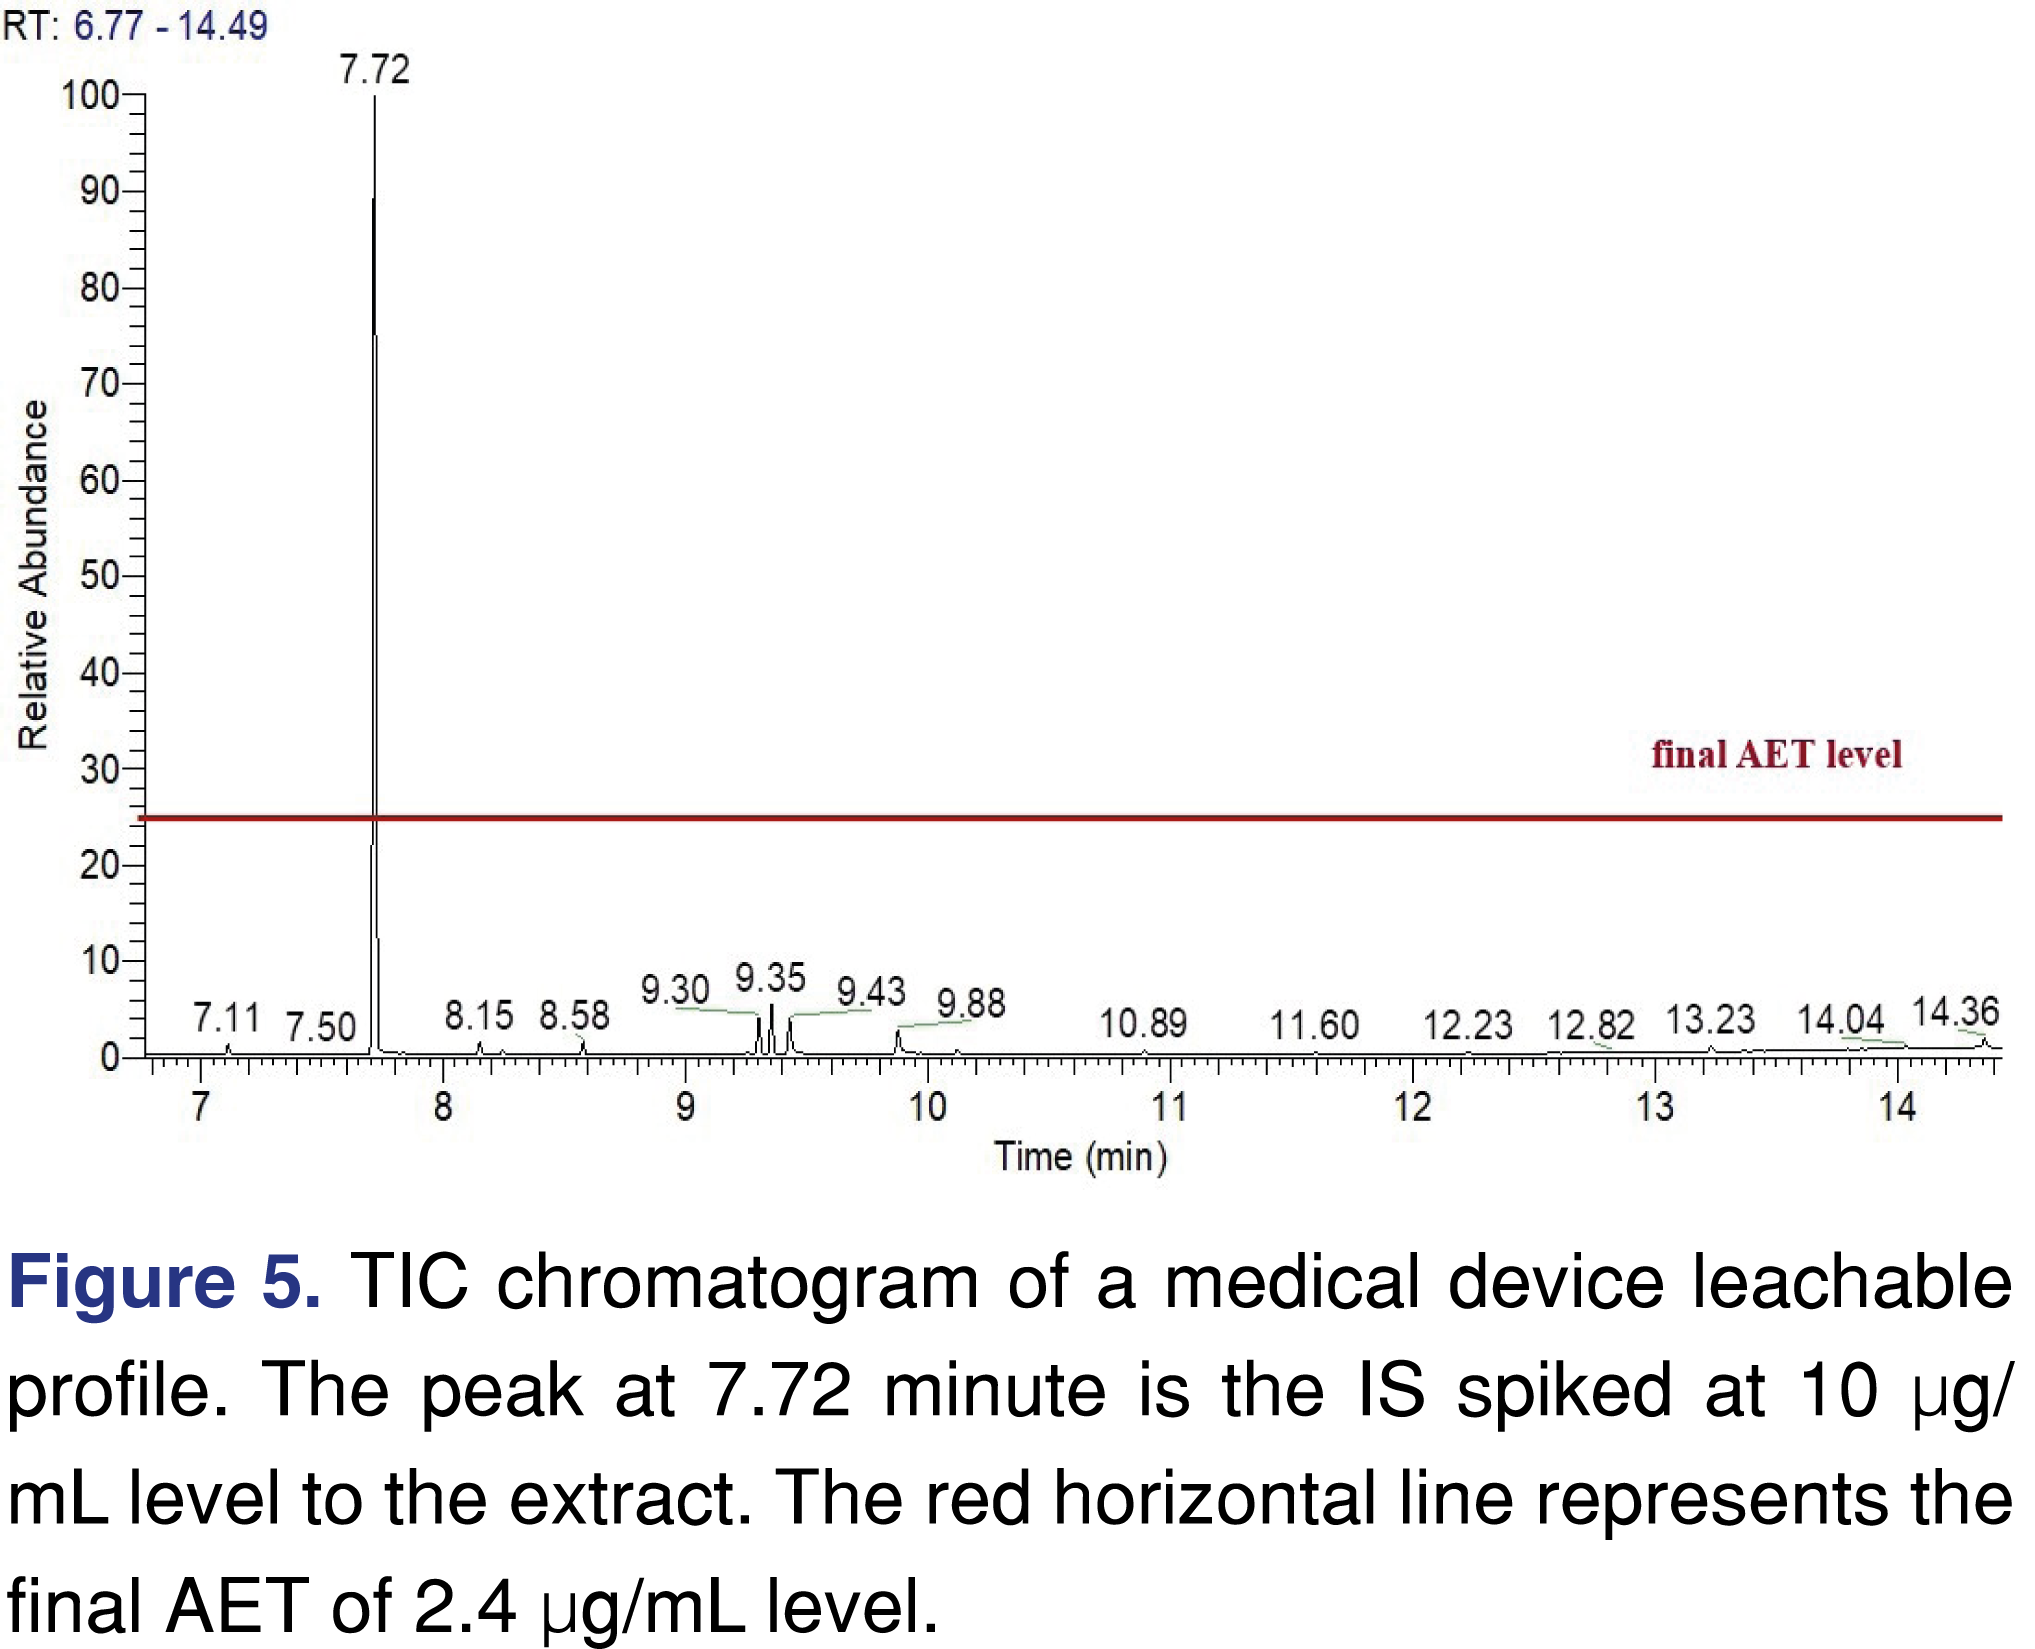
The device is a drug delivery pump, and the AET level for the leachables was calculated as 4.8 µg/mL. After applying an UF=2 the final AET is 2.4 µg/mL. The AET level is high enough that every analytical laboratory in the E&L field should have sufficient instrumentation to perform the testing. Since the delivered drug formulation is aqueous, a dichloromethane extraction was used by both laboratories.
Approach 1
Method suitability was performed by spiking some of the identified extractable species to a bulk drug product at a 4.8 µg/mL level. After performing an extraction, the recoveries were found to be in a range of 12-67%, which seems to be on the low end. According to comments from a particular regulatory reviewer [33], and based on general expectations from the industry for recovery values, it does not meet rigorous scientific standards [34]. However if the results of the leachable testing could be shown to account for the low recoveries, the reported numbers could be justified.
The samples collected from the device were extracted with dichloromethane as described in the experimental section. After extraction the final extracts were spiked with 2-flourobiphenyl IS to a level of 10 µg/mL, which is 4.2 times higher than the final UF corrected AET. The results were reported as no peaks were found above the AET. A single chromatogram was included in the report as a supporting data presented similar to Figure 5.
As presented, the chromatogram in Figure 5 provides sufficient evidence based on the spiked IS response (even if it was spiked above the AET) of sufficient sensitivity; however, it is not clear that no leachables are present at or above the AET level, since the low recovery was not taken into account. The impact of low recovery needs to be considered to provide an accurate result for the quantitation, otherwise certain leachables would be underestimated [33]. Underestimation is particularly unfortunate in impact assessment (e.g., toxicological safety assessment) since an assessment based on an underestimated concentration will result in an inappropriate impact assessment (underestimate the risk). When considering the safety of a drug product, an underestimated leachable level could lead to the conclusion that the leachable has no adverse impact on safety when in fact the opposite is possible [17].
Approach 2.
One approach to show evidence of sufficient recovery is to use a properly selected recovery standard.
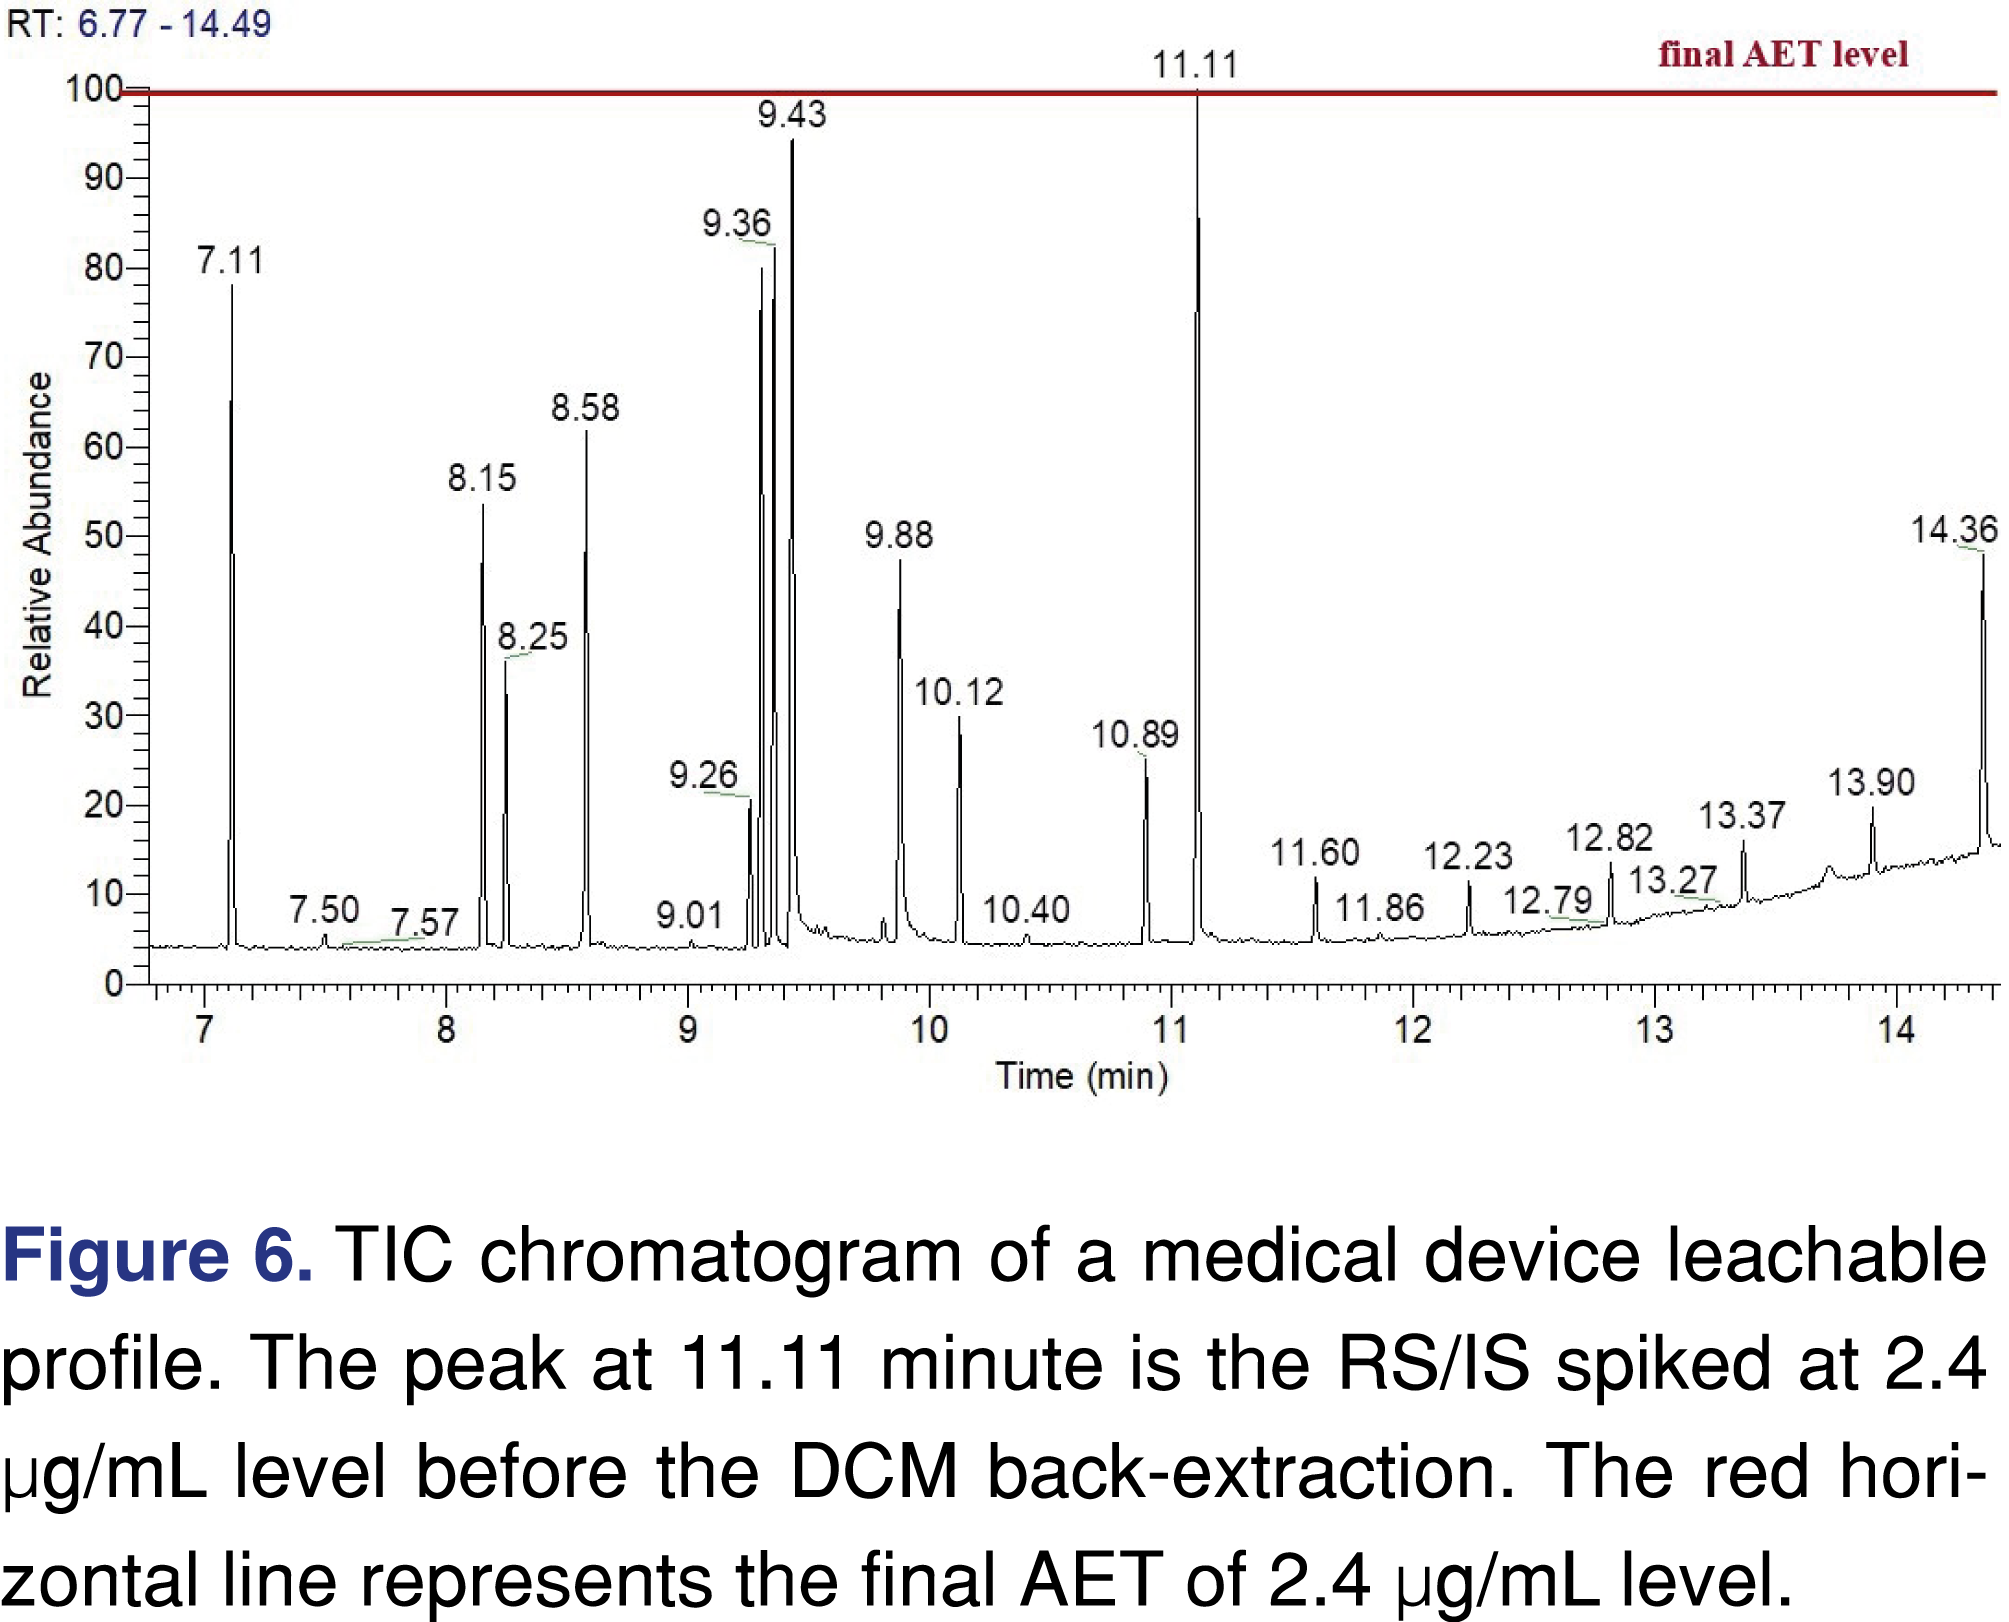
In the second approach, a recovery standard was added to the liquid samples discharged from the delivery device (not the extracts), at the final AET level of 2.4 µg/mL, and the samples prepared through the same extraction process as in Approach 1. The results show a different visual result for the acquired data (Figure 6). Based on the used UF=2, there were still no peaks present above the AET, meaning the reported results are the same as in approach 1. Even when the actual leachable levels were calculated based on their individual response factors, the highest value is 4.1 µg/mL, which is still below the AET; therefore no action needs to be taken. Both approaches resulted in the same reporting outcome; however, the second approach provided higher-quality visual data allowing the reviewer to draw a conclusion with less effort.
2.5.2. E&L evaluation of an LVP finished product, aspects of method suitability tests
Large volume parenterals, due to the low evaluation levels required for leachables, are usually outside of the routine scope of analytical laboratories. A daily dose above 100 mL combined with an SCT (Safety Concern Threshold) of 1.5 µg/day results in AET levels 15 ng/mL. Reaching this low detection level can be challenging for most laboratories and for the majority of the “standard” analytical instrumentation. This section presents a case with two different testing approaches for a large volume parenteral finished product with a 400 mL/day daily dose. One of the approaches was questioned and not accepted by the regulatory agency, as the analytical package was not supported by sufficient data for the method’s limit of detection (as the laboratory claimed), and the presented recoveries were found to be insufficient. Through this example, the authors would like to highlight the importance of an appropriate system suitability method being performed before each analysis, and the importance of reasonable and suitable acceptance criteria for the methods. With the low AET, a reliable and sensitive screening method is very important for both identification and quantitation purposes. If leachables present at the AET level are not detected, the risk assessment carries no real value.
Multiple approaches may be used to provide data for system suitability at low AET levels, however, they have to address all (or most) of the performance check parameters. Usually, it is necessary to provide data for LOD (or LOQ), the desired specificity which can be either chromatographic or spectral based, and some level of method/injection repeatability. To design a suitable method to accomplish this; the following key points should be considered:
– Availability of existing standards for the target analytes. If authentic standard is not available a surrogate can be justified based on chemical structure (substructure) as well as chromatographic and spectral behavior.
– The suitability method must be determined at the AET. Systems and the method should be evaluated at the AET level, otherwise it would be insufficient to justify how the method will be fit for the purpose of detection at low concentrations. For example, it is hard to justify the method suitability if the AET is at ppb level and the spiked internal standard, or recovery standard is at a level multiple orders of magnitude higher, and the spike and recovery is performed at a ppm level.
– The most cost and resource effective way to combine method and system suitability is IS/RS utilization at the AET level. In that case, system suitability provides data which assures the whole analytical process has sufficient extraction efficiency and LOD (or LOQ), and is acceptable at the AET level.
– System suitability tests as such must have pre-defined acceptance criteria for all performance parameters.
For demonstration purposes an aqueous drug formulation with 10 mg/mL API was used. The formulation was not considered complex, but was pH adjusted and contained sodium chloride. The major challenge was the 400 mL/day daily dose, as according to the 1.5 µg/day (1500 ng/day) the dose based AET is calculated to be 3.75 ng/mL (no correction UF was used for the AET calculation). Usually that level of testing requires a targeted approach, which is not the role of a screening method.
Approach I
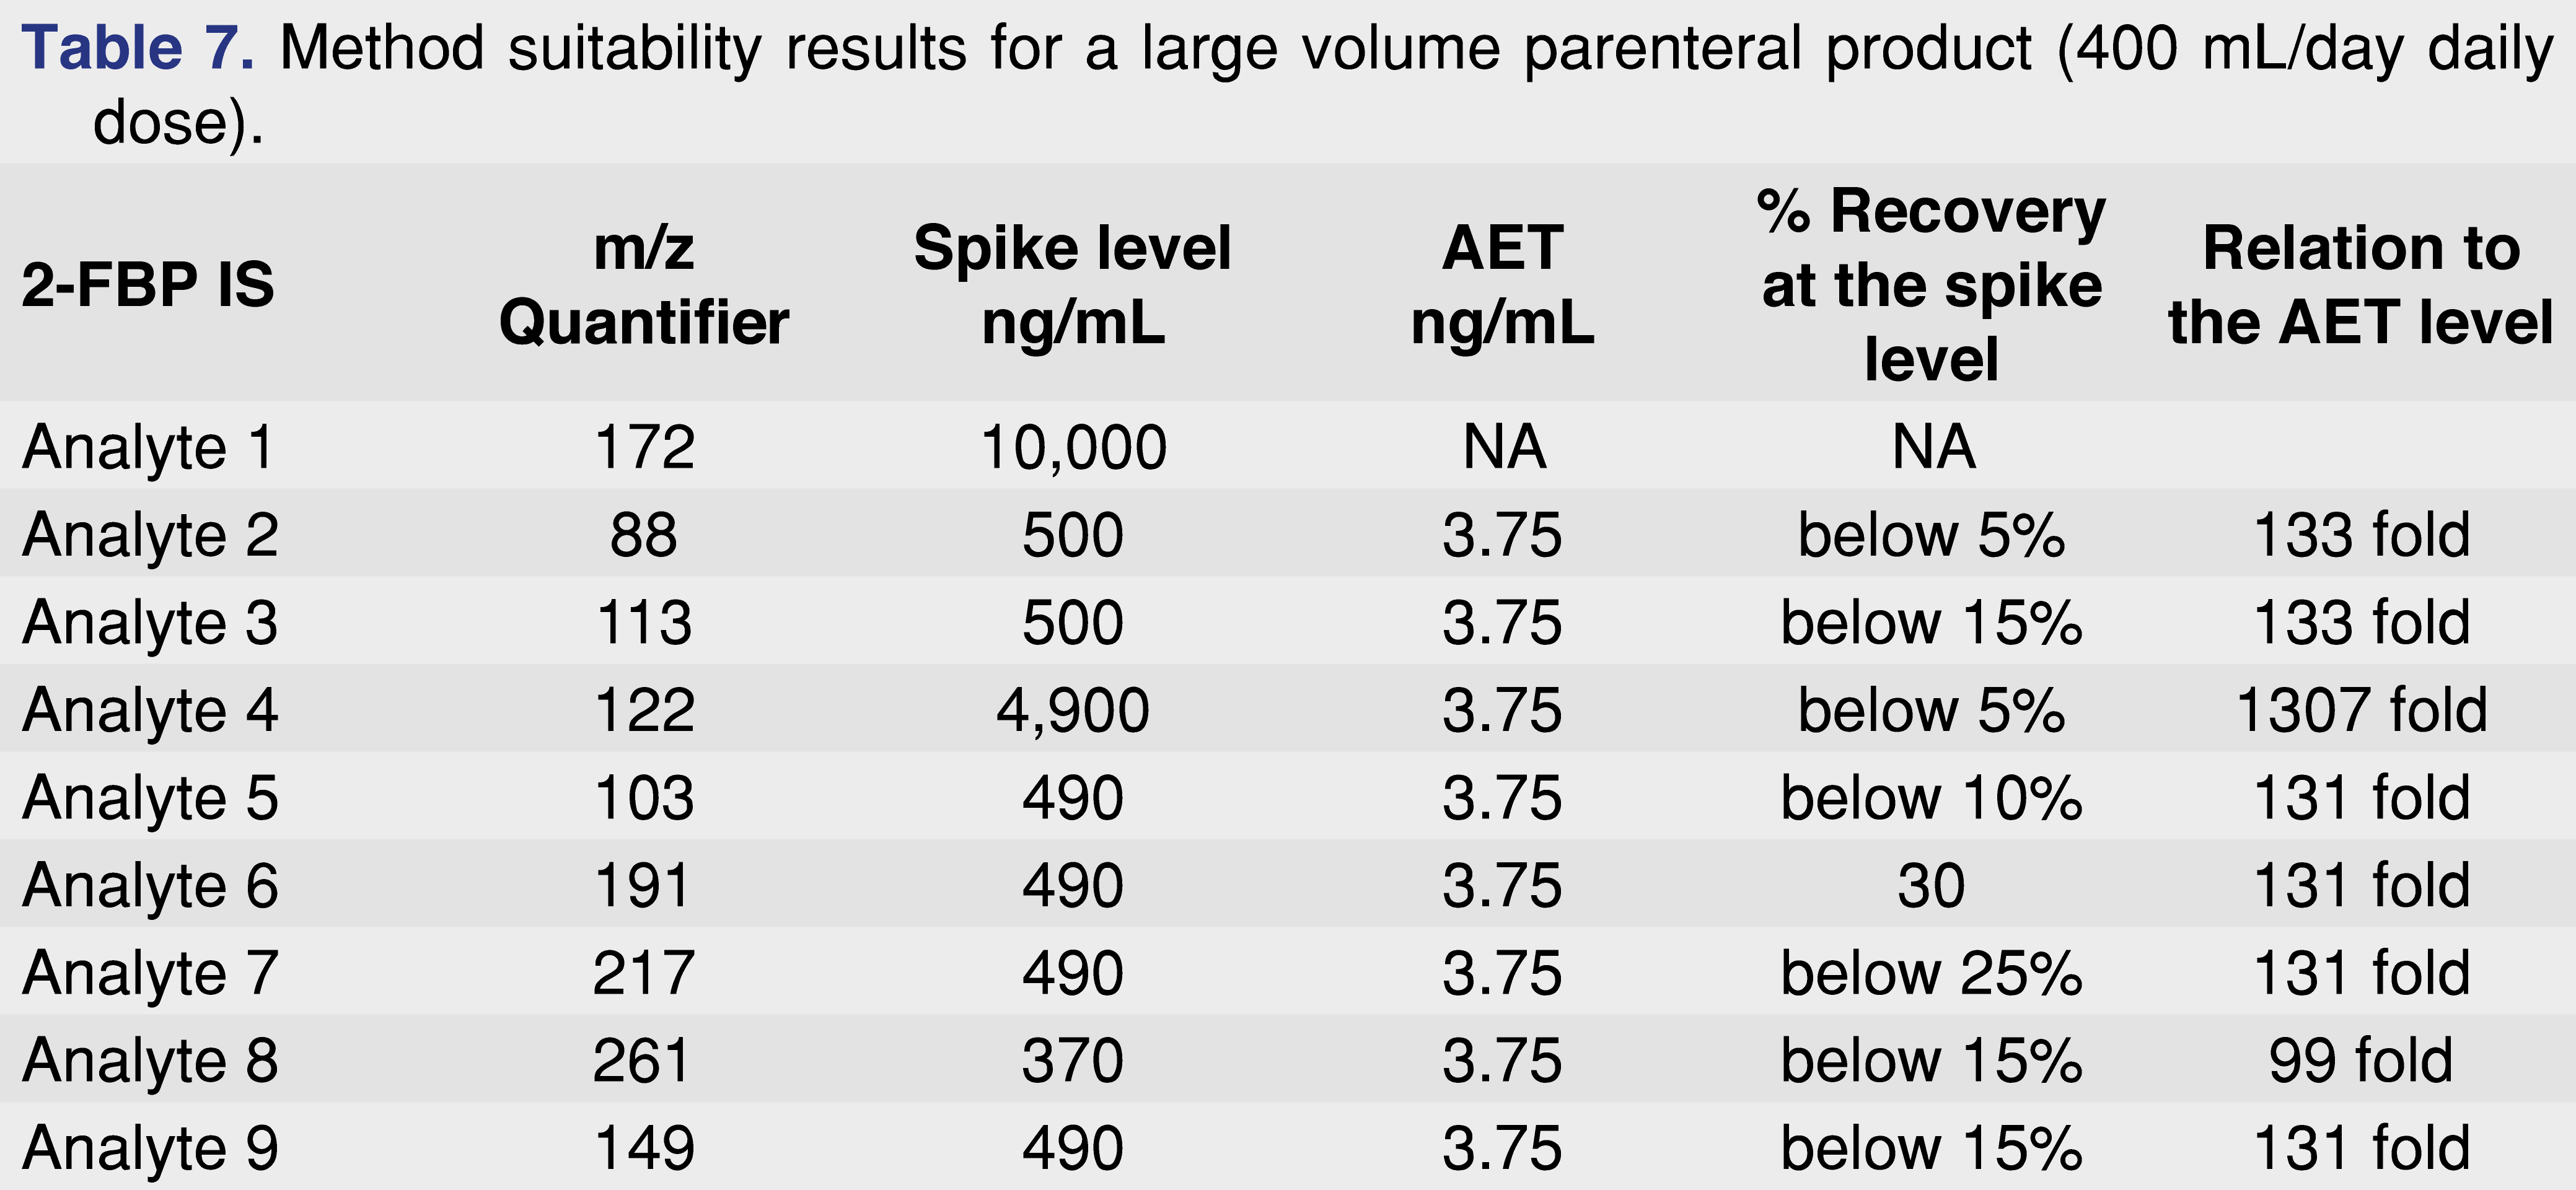
Since the formulation is aqueous-based, it is not amenable for direct GC-MS analysis, therefore an extraction was performed using dichloromethane as the extraction solvent. Before the sample analysis occurred, a method suitability experiment was performed. The method suitability was based on spike and recovery experiments of certain identified extractables which were spiked at a level approximately 100 x higher than the AET of 3.75 ng/mL, and the IS was spiked at 10,000 ng/mL level. The results of the method suitability are presented in Table 7, and demonstrate that the method did not work effectively for the target analytes, indicated by low recovery or insufficient detection for some of the components. Based on this method suitability experiment, it is not clear that the method has a sufficient detection limit or recovery at the required AET level. The analytical data – and the lack of analytical data – presented in Table 7 is a clear indication that neither the system nor the method is suitable for its intended purpose. The low recoveries are only acceptable if the laboratory applies very low scientific standards and no evidence is presented that the method is capable of performing detection at 3.75 ng/mL level. From that point of view, the method should not be used for product testing, since the results would be questioned, as happened during the agency review.
Based on the data set presented in Table 7, there is a significant value of meaningful system suitability (and method suitability) with associated acceptance criteria, achieved by utilization of the most effective option performed in a single step before every analysis sequence (for example multiple injections of appropriate level surrogate or target standard solution).
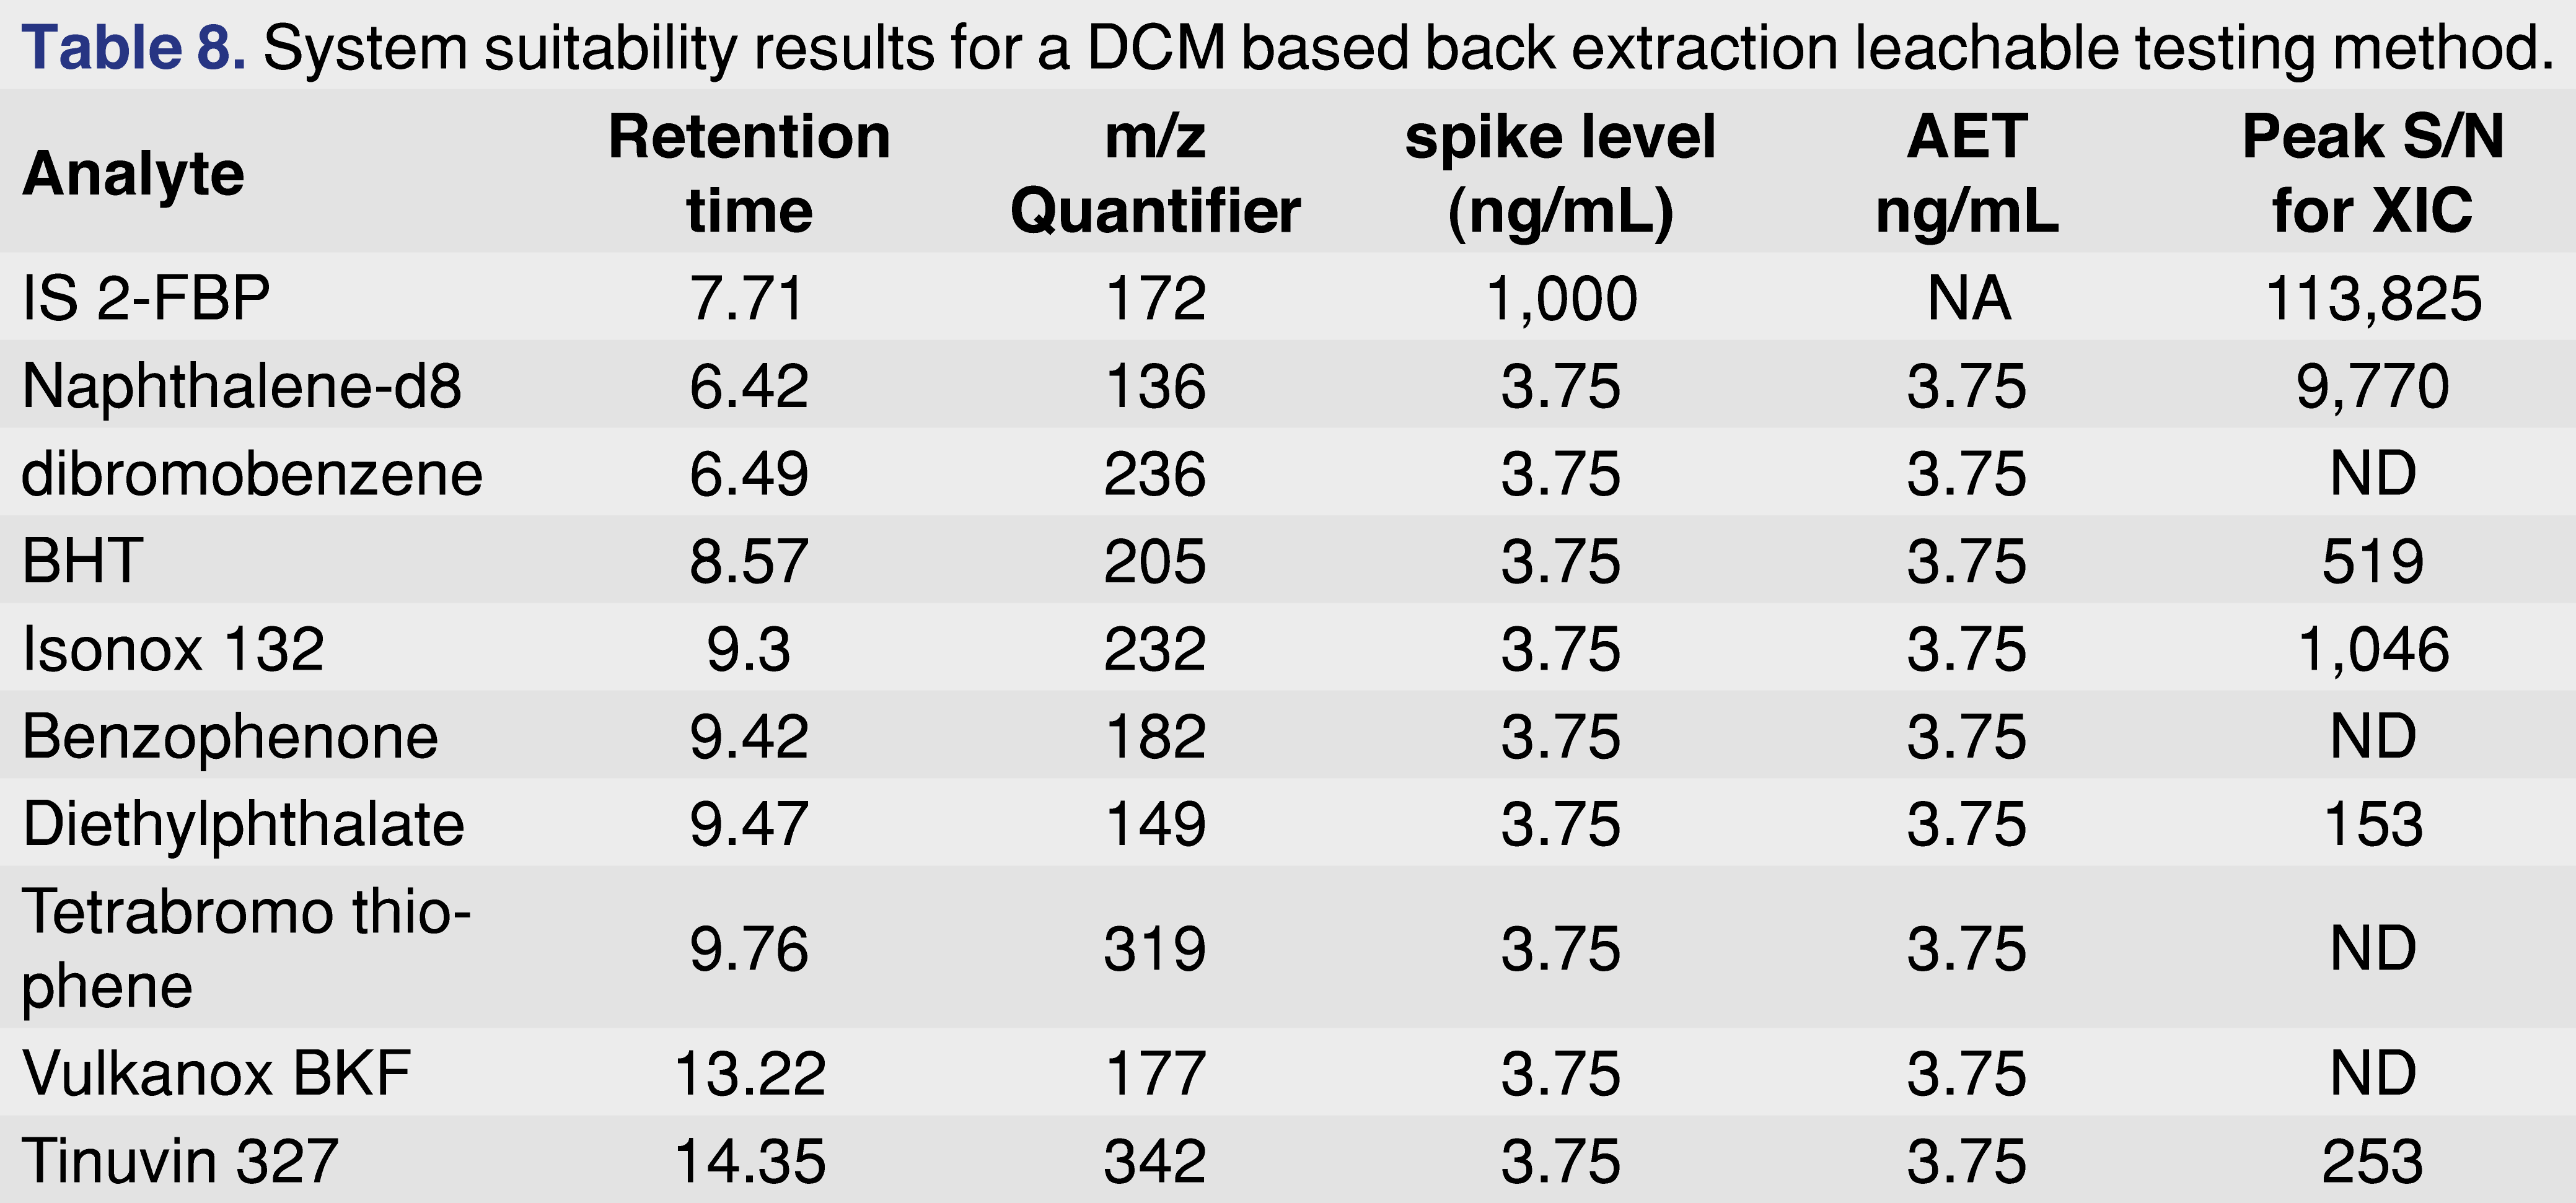
The next data set presented demonstrates the detection method proved sufficient, but the extraction method did not, as well as having an example where both the extraction and the detection method proved to be sufficient to provide data at the low AET level. A bulk (non-packaged) LVP finished product was spiked with 9 different chemicals that represented a range of chemical classes, polarities, and boiling points. Each target chemicals were spiked at a level of 3.75 ng/mL level and the IS/RS 2-fluoropbiphenyl at a 1000 ng/mL level. The spiked sample was extracted with dichloromethane, concentrated, and injected onto a GC-MS using a cold PTV injection method. The result of the testing is presented in Table 8.
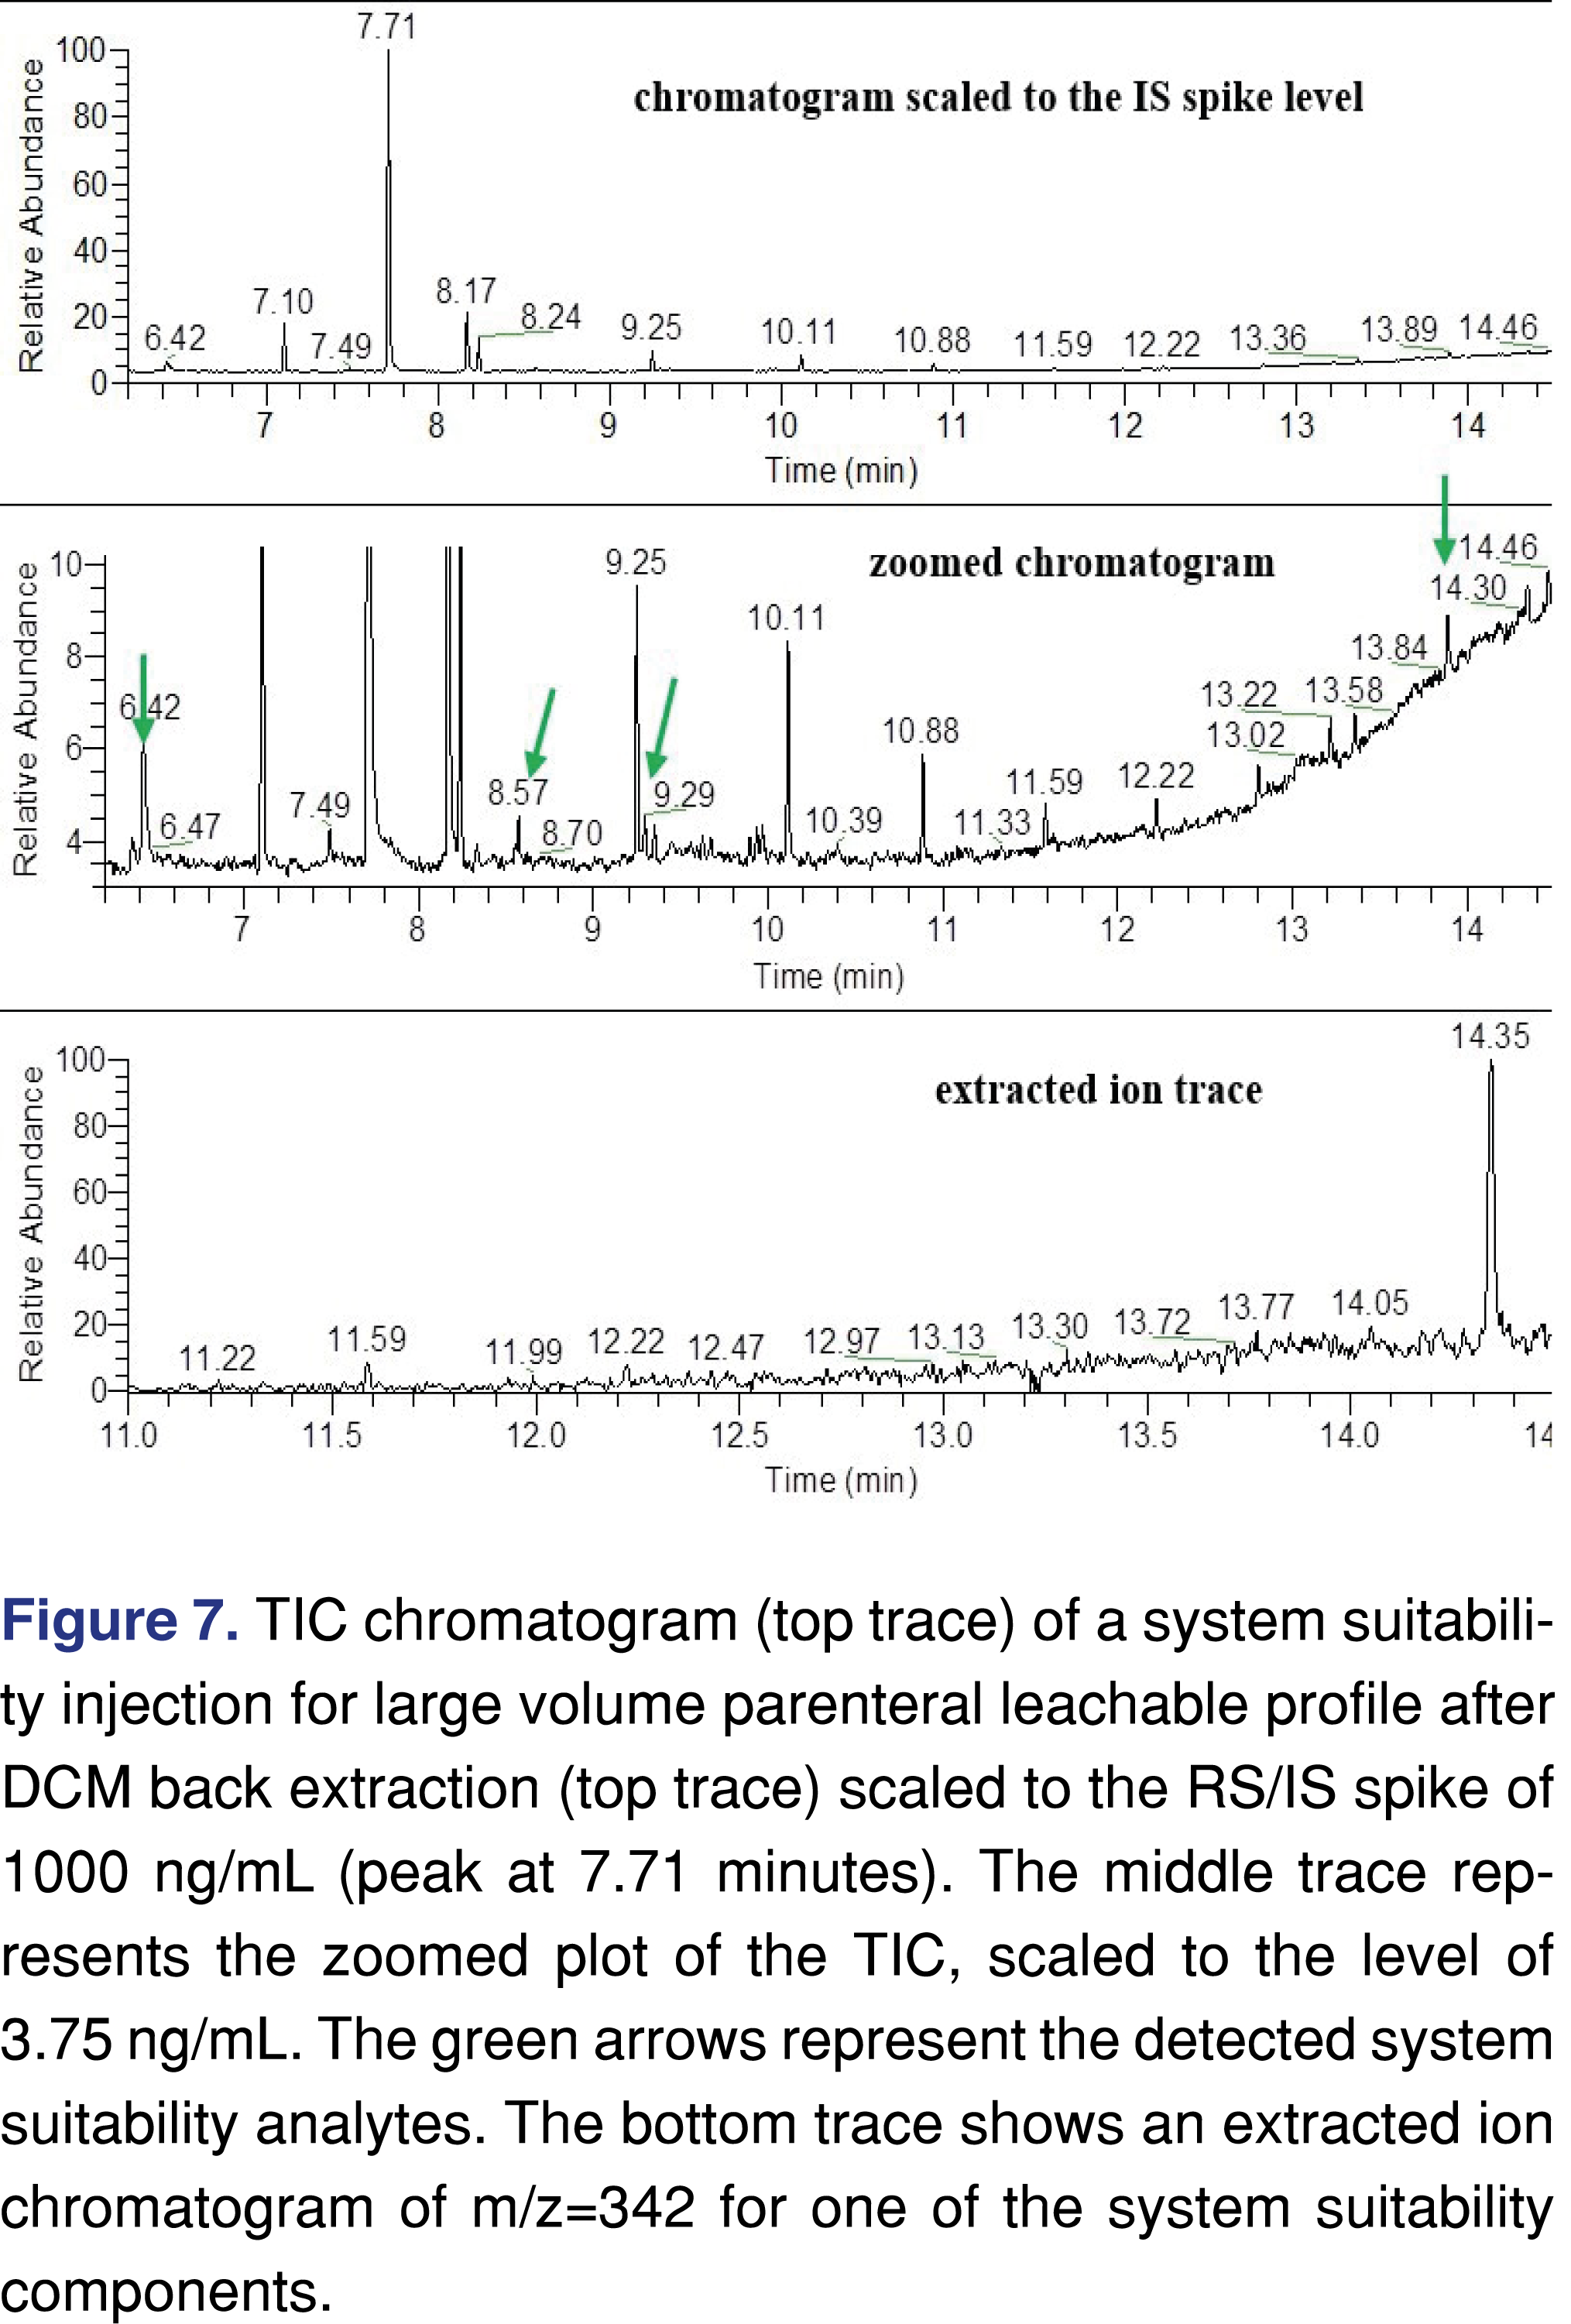
The data set in Table 8 shows that for some of the standards, detection was achieved at the AET level, therefore it can be concluded that the detection method is sufficient. However, it seems there are some issues with the extraction method, as it was not sufficient to extract all target analytes at the AET level. For system suitability purposes, a signal-to-noise calculation is one of the ways to provide evidence of method performance. Evaluation of the TIC trace is generally acceptable in that it represents an “FID-like” general picture; however in this particular case it is important to note that is very difficult to process the TIC, and it is more effective to use the individual extracted ion chromatograms. This data can be presented in different ways, and the presentation method can help the agency reviewer decide if the screening method is fit for purpose or needs to be revised. The chromatographic plots are presented in Figure 7. One presentation is to plot the chromatograms to the scale of the spiked IS level (top trace in Figure 7), however, as the IS was spiked at a 266 times higher concentration than the AET level, this display does not convey all of the necessary information. A more informative plot is zoomed so that the spiked analyte (mid trace in Figure 7), peaks are visible, and clearly marked. This plot can be supported with individual extracted ion traces, as shown on the bottom trace. The authors understand that this step requires additional work from the testing laboratory, but it is our opinion that if these additional visualizations help to expedite the regulatory review process, they are worth the effort and should be included.
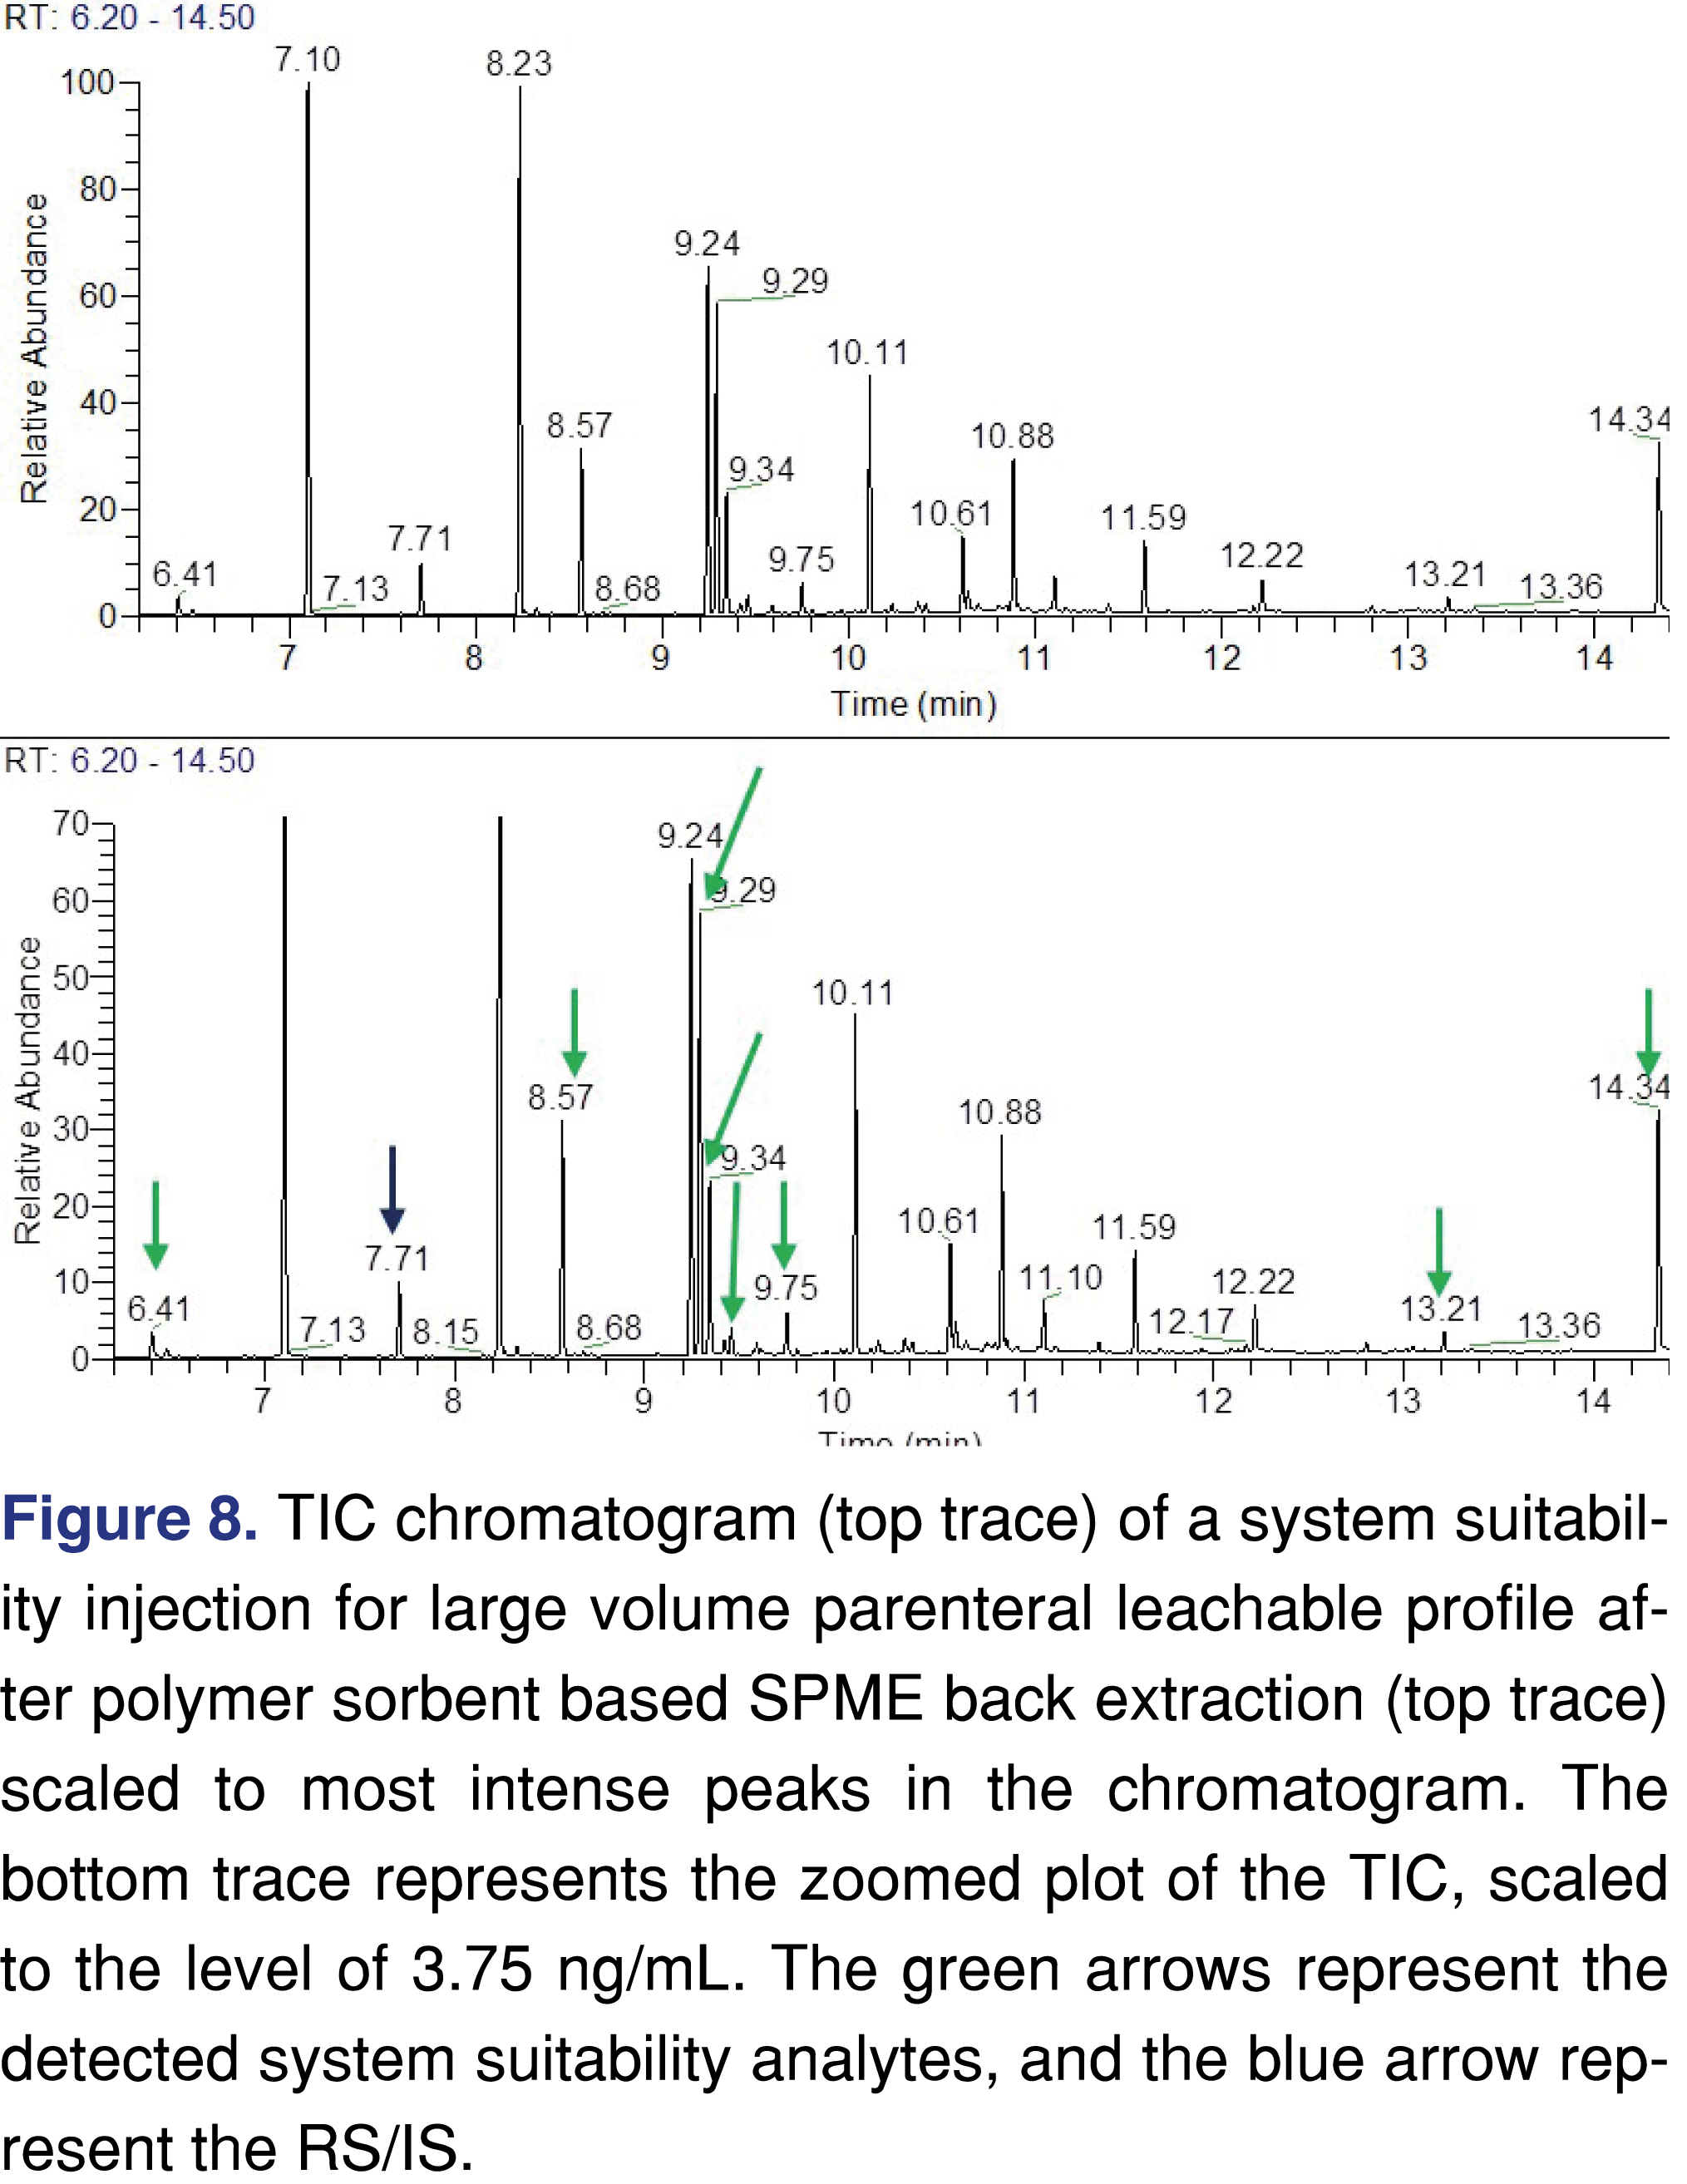
Finally, a data set is presented after DP specific method development (it is important to note that the presented method works very well for the list of components presented here, and the rule of thumb in our laboratory is that methods and extraction techniques should be modified to have the best fit for the potential target analytes). In this experiment, the IS/RS of 2-fluorobiphenyl was spiked directly to the drug formulation along with the target components at the AET level of 3.75 ng/mL level. A polymer sorbent-based extraction (SPME) was used to extract the analytes. All the analytes were recovered as well as the IS/RS. The extraction was repeated 6 times from 6 individual samples, to show that the method is repeatable and meets industry expectations [34,35]. The signal-to-noise ratios were calculated, and they indicate that the method has sufficient detection capability. However, with the more widespread use of HRAM based detection, the S/N calculation may not be the most appropriate system suitability parameter [36,37] as discussed later. The data set presented in Table 9. A representative chromatogram of the sample is plotted in Figure 8. The top trace is scaled to the most intense peak in the chromatogram and, as is expected at this low target level, there are some background peaks present at a higher intensity than the targets. The bottom trace is a zoomed TIC, where all the target analytes were marked with a green arrow and the IS/RS peak was marked with a blue arrow. The peaks are clearly detectable and an agency reviewer should have no doubt that the method is suitable for its designed purpose.
The last point we would like to discuss is a recommendation for the acceptable data variance of the data sets. It is important to understand what is justifiable as a “normal variance” and what is caused by avoidable factors, such as an inappropriate analytical system or detection conditions. Over the years, many regulatory agencies who review trace level data (usually environmental or food), have made recommendations on what is an acceptable error for certain testing [23,33,38]. The level of the target analytes is one of the most important points when such criteria are determined by a laboratory; the acceptable variance at ppm level is much lower than in ppb levels (see Table 9). This idea should be reflected when system suitability is designed. Unfortunately, some of the position papers in the E&L field recommend acceptance criteria for system suitability based on an agreement between industry players rather than regulatory agency recommendation or based on scientific justification [34,39]. We hope to begin a discussion that will be part of the evaluation criteria when the industry moves towards standardized method(s) for E&L testing.
2.6.7. How low in sensitivity level should the laboratory go for leachable evaluation of finished drug product samples?
The obvious answer is as low as the SCT based AET is commanding; however, there are sometimes limitations to that approach. There is always a question when a laboratory engaging in a discussion with a client or when a sponsor has a discussion with the regulatory agency. The exact value for that level is being determined and driven by the AET (which is a function of the dose and the route of administration); however, there is a technical limitation of current analytical technology capabilities [29,40]. It is not necessary to explain that as we are moving to a higher dosage forms, the AET is getting lower, therefore the analytical testing is getting more and more challenging task. For example, if a certain product has a 70 liter daily dose (example: immersion hydrotherapy for burn injuries), resulting in a 21.4 ng/L AET (see equation 2), it may be suitable for targeted testing; however, untargeted screening is practically non-achievable.

The example above was an extreme presentation, and usually laboratories are not dealing with higher than a 10 liter daily dose; however, in recent communication with a regulatory reviewer related to known health risk analytes (nitrosamines), the agency wishes to see validated analytical methods reaching at 25 pg/L (250 ppq), which are not possible to achieve with current available analytical methodology, even when a targeted approach is being used for the testing.
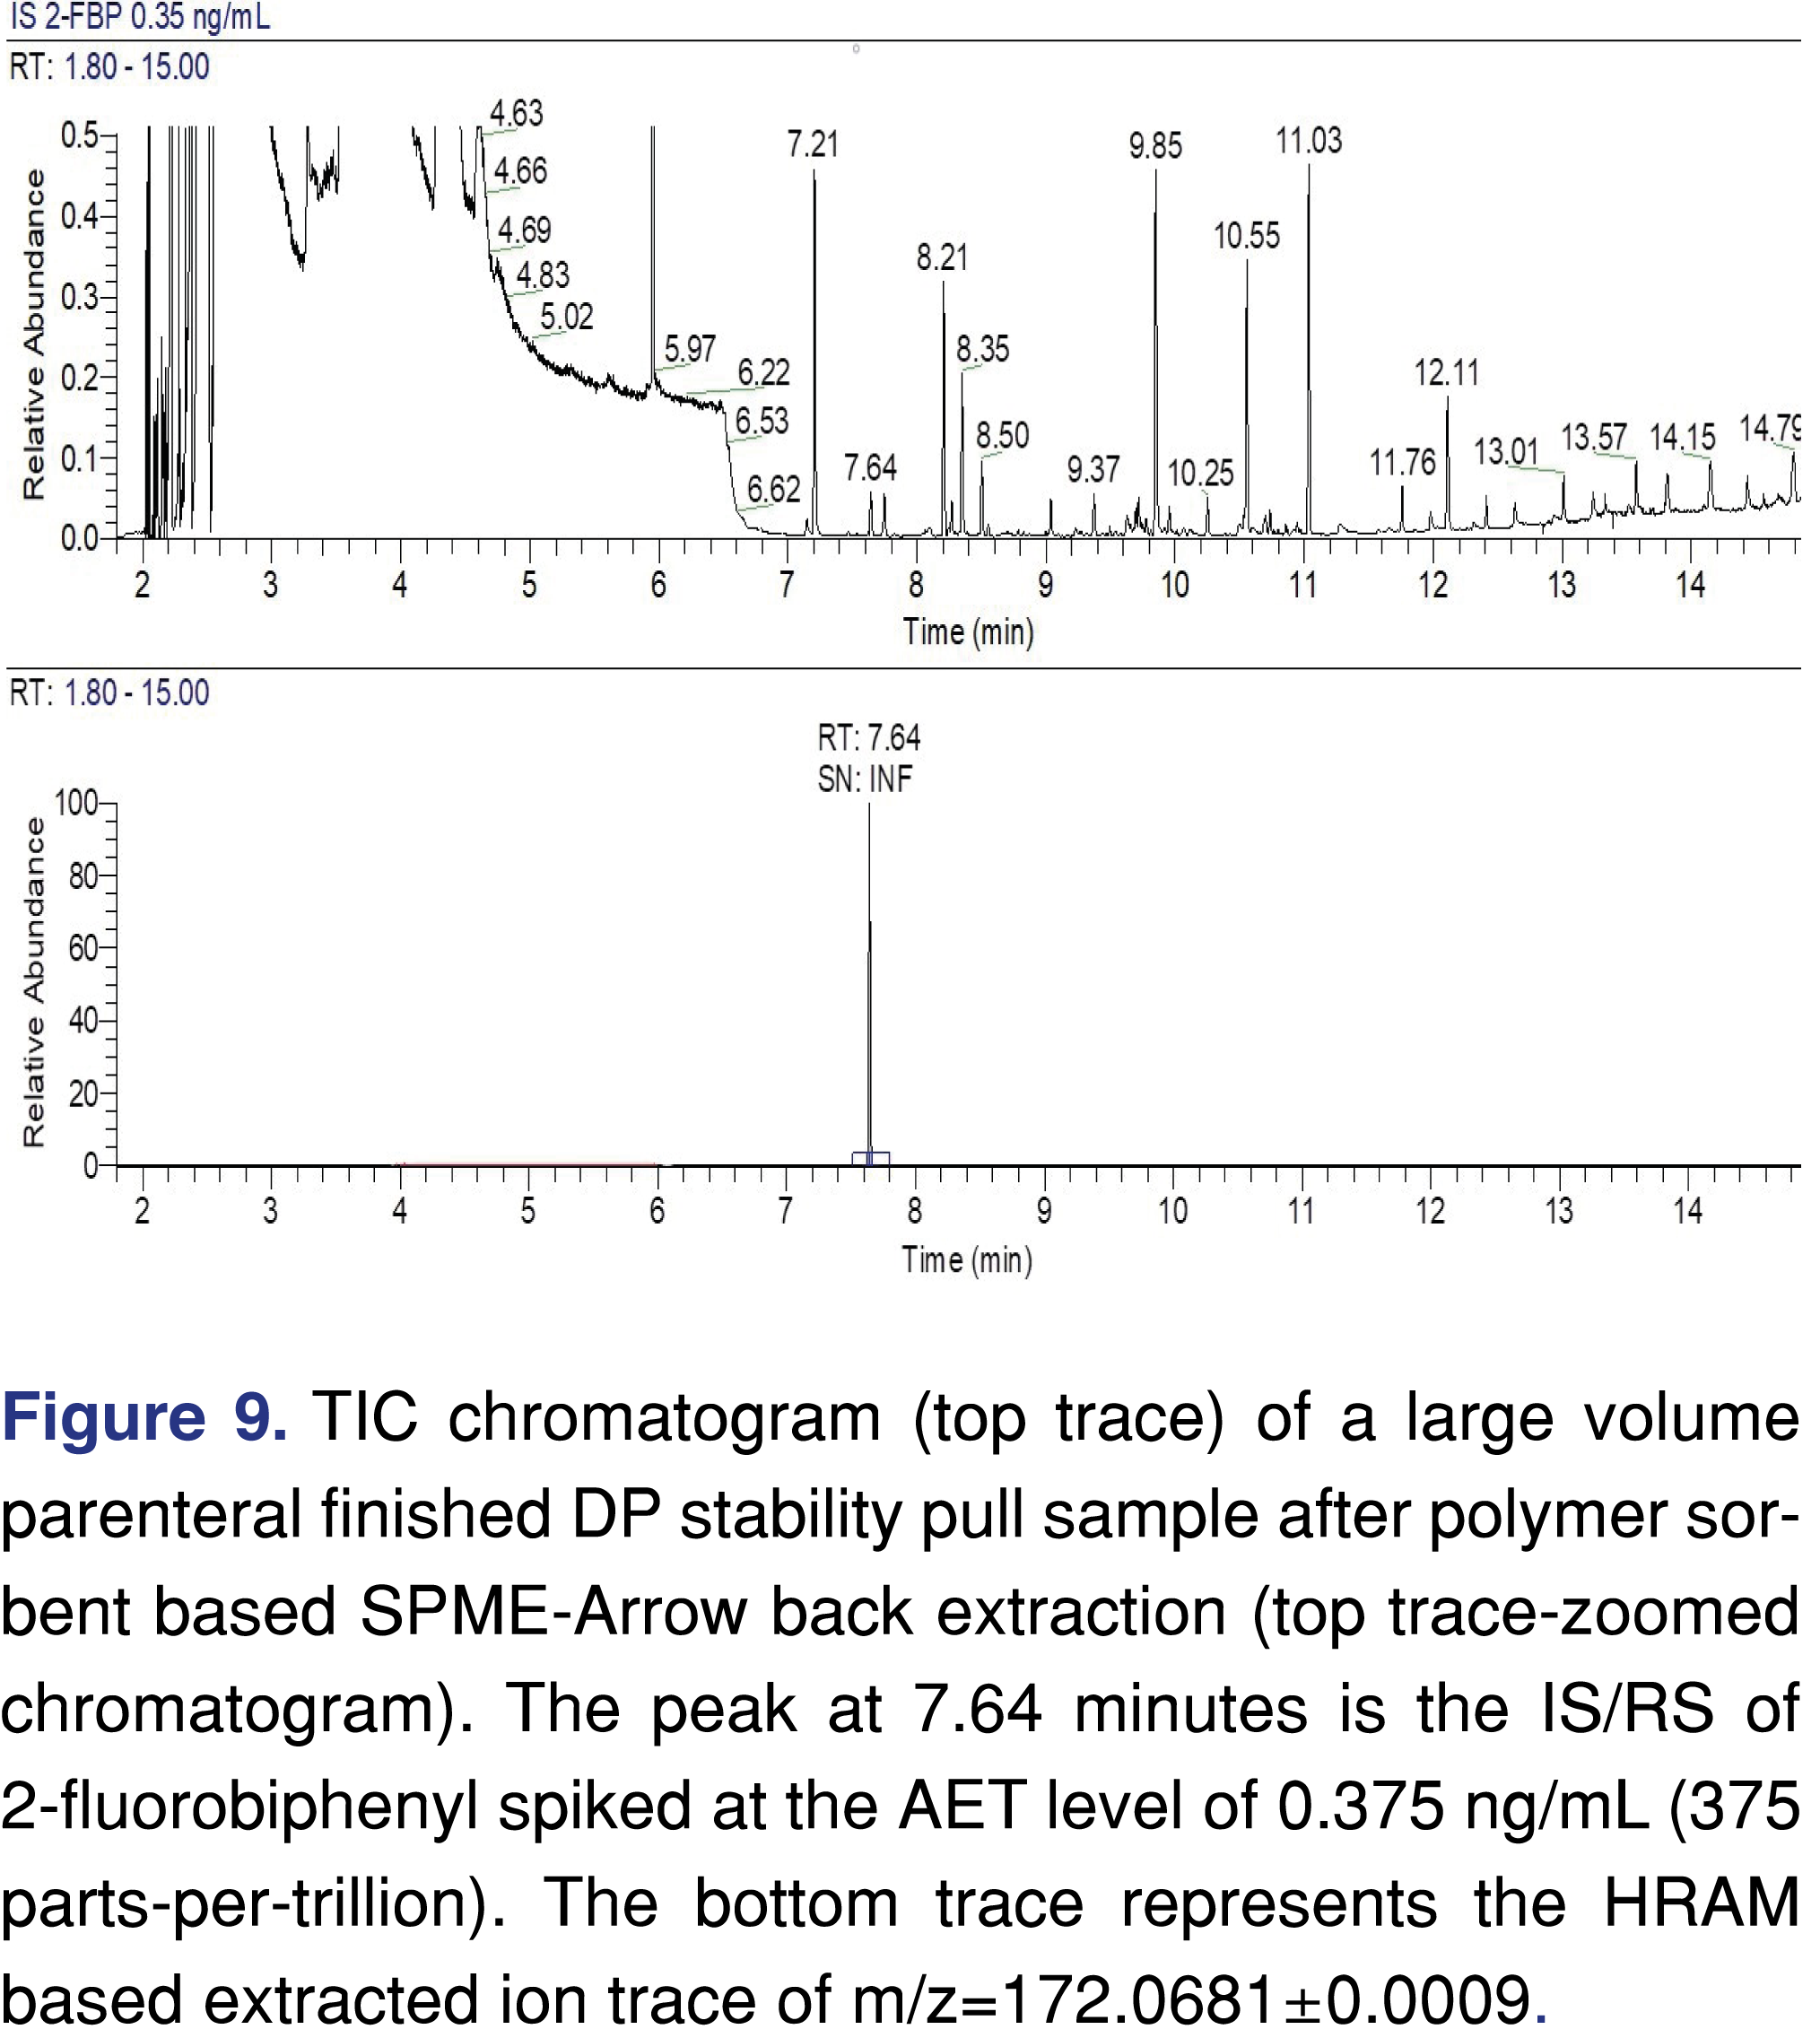
The example presented below is for a maximum daily dose of 4 L/day, which results in a 375 ng/L (0.375 ng/mL) AET. The finished product is an aqueous formulation with a low level of salt API and pH adjustment chemicals. The presented example is from a stability pull, and the finished drug product was spiked with IS/RS of 2-FBP at the AET level of 0.375 ng/mL level. The sample was extracted using SPME-Arrow and analyzed with an HRAM based GC-MS system in scan data acquisition mode. The acquired chromatograms are presented in Figure 9. The top trace shows the zoomed section of the TIC, and as expected there are larger peaks observed; however the IS/RS is clearly visible at 7.64 minute, proving that the method has sufficient sensitivity to detect leachables at the required AET level. The extracted ion trace of m/z=172.0681 shows a single peak in the entire chromatogram and no chemical or electronic noise observed. In this case, S/N ratio cannot be used to determine the LOD; thus the LOD can only be calculated by a statistical approach [26]. It also provides evidence that the approach of calculating and reporting the LOD limit based on a high level of standard injection and extrapolation of the observed S/N down to 3:1 is not a justifiable scientific approach.
3.0 Summary
Case studies of analytical approaches are presented in this paper related to leachable testing of different pharmaceutical products and analytical investigations of low-level impurities. The importance of a high performing and reliable screening method was discussed and explained. Current flaws with the non-standardized testing methodology were indicated, and possible solutions for improvement were proposed for those specific cases. The importance of a science-based method and system suitability was highlighted. While response factor databases are the best way for quantitative estimation of leachables in finished drug products, limitations of those databases related to different instrument platforms, and the concentration of the standard solutions as well as the effect of the sample matrix were explored and discussed.
4.0 Acknowledgment
The authors would like to thank Dr. Daniel Norwood and Dr. Dennis Jenke for the valuable discussions over the years. Those discussions were inspirational and priceless to gain better understanding of the related field, and the issues associated to extractables and leachables testing.
5.0 References
- Guidance for Industry Container Closure Systems for Packaging Human Drugs and Biologic, FDA CBER, FDA CDER, (1999). Available at https://www.fda.gov/media/70788/download
- 21 CFR 211, subpart G; Packaging and labeling control. Available at https://www.accessdata.fda.gov/scripts/cdrh/cfdocs/cfcfr/CFRSearch.cfm?CFRPart=211&showFR=1&subpartNode=21:4.0.1.1.11.7
- USP Chapters 1663, 1664, 661, 663
- ISO 10993-18:2020(E), Biological evaluation of medical devices —Part 18: Chemical characterization of medical device materials within a risk management process (2020).
- Sawant A. Preliminary results of a PDA task force examining the cause, prevention and management of TBA and TCA taints in PDA/FDA Pharmaceutical Supply Chain Conference (2011).
- r_SJN-DO WL Response McNeil Las Piedras PR 2-5-(2010). Available at https://www.fda.gov/media/78513/download
- ICH Topic Q 3 B (R2). Impurities in New Drug Products, CPMP/ICH/2738/99 (2006). Available at https://database.ich.org/sites/default/files/Q3B%28R2%29%20Guideline.pdf
- PQRI Safety Thresholds and Best Practices for Extractables and Leachables in Orally Inhaled and Nasal Drug Products (2006). Available at https://pqri.org/wp-content/uploads/2015/08/pdf/LE_Recommendations_to_FDA_09-29-06.pdf
- Q2 (R1) Validation of Analytical Procedures: Text and Methodology (1995). Available at https://database.ich.org/sites/default/files/Q2%28R1%29%20Guideline.pdf
- Ermer J. J. H. Miller, Method Validation in Pharmaceutical Analysis Wiley, 1st edition 2005. Wiley-VCH Verlag GmbH & Co. KGaA, Weinheim, Germany. ISBN:3-527-31255-2.
- Christiaens P, Beusen JM, Verlinde P, Baeten J, Jenke D. Identifying and Mitigating Errors in Screening for Organic Extractables and Leachables: Part 1—Introduction to Errors in Chromatographic Screening for Organic Extractables and Leachables and Discussion of the Errors of Omission. PDA J Pharm Sci Tech January 74(1) 90-107 (2020). https://doi.org/10.5731/pdajpst.2018.009761
- Christiaens P, Beusen JM, Verlinde P, Baeten J, Jenke D. Identifying and Mitigating Errors in Screening for Organic Extractables and Leachables: Part 2—Errors of Inexact Identification and Inaccurate Quantitation PDA J Pharm Sci Tech 74(1), 108-133 (2020). https://doi.org/10.5731/pdajpst.2018.009779
- Jenke D. Identification and Quantitation Classifications for Extractables and Leachables, PDA J Pharm Sci Tech March 74(2), 275-285 (2020). https://doi.org/10.5731/pdajpst.2019.010538
- Jenke D, Odufu A. Utilization of Internal Standard Response Factors to Estimate the Concentration of Organic Compounds Leached from Pharmaceutical Packaging Systems and Application of Such Estimated Concentrations to Safety Assessment. J Chrom Sci 50, 206–212 (2012). https://doi.org/10.1093/chromsci/bmr048
- Norwood DL, Nagao LM, Stults MS. Perspectives on the PQRI Extractables and Leachables “Safety Thresholds and Best Practices” Recommendations for Inhalation Drug Products PDA J Pharm Sci Tech 67(5) (2013). https://doi.org/10.5731/pdajpst.2013.00934
- Zdravkovic S A. Duong CT. Hellenbrand AA, Duff SR, Dreger AL. Establishment of a reference standard database for use in the qualitative and semi-quantitative analysis of pharmaceutical contact materials within an extractables survey by GC–MS J of Pharm and Biomed 151, 49–60 (2018). https://doi.org/10.1016/j.jpba.2017.12.054
- Jenke D. Correcting the Analytical Evaluation Threshold (AET) and Reported Extractable’s Concentrations for Analytical Response Factor Uncertainty Associated with Chromatographic Screening for Extractables/Leachables, PDA J Pharm Sci Tech 74(3), 348-358 (2020). https://doi.org/10.5731/pdajpst.2019.010520
- Vas G, Fleck L, Carpenter H, Huang JT. Evaluation of Relative Response Factors for Multiple Common Extractable Chemicals. Smithers Rapra Extractables & Leachables US 2018 Conference Bethesda, Maryland, May 7-9, (2018).
- Jordi MA et al. Qualitative assessment of extractables from single-use components and the impact of reference standard selection. J Pharm Biomed 150, 368–376 (2018). https://doi.org/10.1016/j.jpba.2017.12.029
- Isella F, Canellas E, Bosettia O, Nerin C. Migration of non-intentionally added substances from adhesives by UPLC–Q-TOF/MS and the role of EVOH to avoid migration in multilayer packaging materials. J. Mass Spectrom. 48, 430–437 (2013). https://doi.org/10.1002/jms.3165
- Vas G, Fleck L, Carpenter H, Panetta T. Leachable testing for large volume parenteral products. How to achieve ppb and sub-ppb detection and quantitation limits for complex matrices? Smithers Rapra Extractables & Leachables US 2015 Conference Washington D.C., May 12-14 (2015).
- Ball JB, Norwood DL, Stults Cl, Nagao LM. Leachables and Extractables Handbook, John Wiley and Sons Inc., (2012). https://doi.org/10.1002/9781118147672
- Boyd R, Basic C, Bethem RA. Trace Quantitative Analysis by Mass Spectrometry, John Wiley and Sons Ltd. (2008). John Wiley & Sons Ltd. The Atrium, Southern Gate, Chichester, West Sussex England, ISBN: 978-0-470-05771-1.
- Vas G, Vekey K. Solid-phase microextraction: a powerful sample preparation tool prior to mass spectrometric analysis. J Mass Spectrom 39, 233–254 (2004). https://doi.org/10.1002/jms.606
- Vas G, Alquier L, Maryanoff CM, Cohen J, Reed G. Investigation of mass-balance issue in e-beam sterilized paclitaxel eluting coronary stents by SPME/GC–MS. J Pharm Biomed 48, 568–572 (2008). https://doi.org/10.1016/j.jpba.2008.05.031
- Vas G, Fleck L, Comstock K, Cole J. Extractable and Leachable Testing for Pharmaceutical Packaging, Finished Pharmaceutical Products, and Medical Devices: An Analytical Perspective. Curr Trend Mass Spectrom 5-14 (2020).
- Gerstel Inc. Sample Introduction Techniques for Capillary Gas Chromatography, version 3.0 11/1998.
- Snow N. Introduction to Capillary GC Injection Techniques. .
- Huang JT, Alquier L, Kaisa JP, Reed G, Gilmor T, Vas G. Method development and validation for the determination of 2,4,6-tribromoanisole, 2,4,6-tribromophenol, 2,4,6-trichloroanisole, and 2,4,6-trichlorophenol in various drug products using stir bar sorptive extraction and gas chromatography–tandem mass spectrometry detection. J Chrom A, 1262, 196– 204 (2012). https://doi.org/10.1016/j.chroma.2012.09.010
- Jordi MA et al. Reducing relative response factor variation using a multi detector approach for extractables and leachables (E&L) analysis to mitigate the need for uncertainty factors. J Pharm and Biomed 186, 113334 (2020). https://doi.org/10.1016/j.jpba.2020.113334
- Li K, Cardoen D. Transformation of Toxicology Data into Specific PDE’s. Biopharma Asia Webinar, 23 April (2020). Available at https://biopharma-asia.com/webinars/transformation-of-toxicology-data-into-specific-pdes/
- Bonn J. Improved Techniques for Sampling and Sample Introduction in Gas Chromatography in: Licentiate thesis in Chemistry School of Chemical Science and Engineering Department of Chemistry Division of Analytical Chemistry Royal Institute of Technology Stockholm (2008). Available at http://kth.diva-portal.org/smash/get/diva2:13747/FULLTEXT01.pdf
- Sarafanov A. Issues frequently observed in analytical evaluation of leachables in drug products (a review experience). PharmaEd Extractables & Leachables Boston 2019, April 10 –11, Metro Meeting Centers, Boston, MA, USA (2019).
- Alegre MR, Romero JE, Broch SC. Is it really necessary to validate an analytical method or not? That is the question. J Chrom A, 1232, 101– 109 (2012). https://doi.org/10.1016/j.chroma.2011.10.050
- Horwitz W, Albert R. The Horwitz Ratio: A Useful Index of Method Performance with Respect to Precision. J AOAC Int 89(4), 1095-1109 (2006). https://doi.org/10.1093/jaoac/89.4.1095
- Wells G, Prest H. Why Use Signal-To- Noise as a Measure of MS Performance When It Is Often Meaningless? (Agilent Technical Overview. 5990–8341 (2011). Available at https://www.agilent.com/cs/library/technicaloverviews/public/5990-8341EN.pdf
- Sheehan TL, Yost AR. Curr Trends Mass Spectrom. 13(8), 16–22 (2015).
- Commission Decision of 12 August 2002 Implementing Council Directive 96/23/EC concerning the performance of analytical methods and the interpretation of results (notified under document number C(2002) 3044) (2002/657/EC). Available at https://op.europa.eu/en/publication-detail/-/publication/ed928116-a955-4a84-b10a-cf7a82bad858/language-en
- Ding W, Madsen G, Mahajan E, O’ Connor S, Wong K. Standardized Extractables Testing Protocol for Single-Use Systems in Biomanufacturing. Pharm Eng, 34 (2014).
- Armstrong BL, Senyurt AF, Narayan V, Wang X, Alquier L, Vas G. Stir bar sorptive extraction combined with GC–MS/MS for determination of low level leachable components from implantable medical devices, J Pharm Biomed 74, 162– 170 (2013). https://doi.org/10.1016/j.jpba.2012.10.019
All site content, except where otherwise noted, is licensed under a Creative Commons Attribution 4.0 License